
Our analysis has taken us through a tour of the SD-WAN market, types of providers, service features, and pricing.
Today we apply SD-WAN prices to a hypothetical model of a global WAN to explore how different network configurations paired with SD-WAN can affect total WAN costs.
While enhanced performance and network agility are drivers for implementing a hybrid network with SD-WAN, enterprises are not immune to cost.
Cutting costs ranked fourth amongst WAN managers as a reason for adopting SD-WAN in 2020.
In fact, cutting costs ranked fourth among WAN managers as a reason for adopting SD-WAN in 2020.
We’ve explored different pricing models available in the SD-WAN marketplace and how various cost components break out by provider. But, to provide insight into how incorporating SD-WAN into the corporate WAN can impact total network spend, it's useful to look at how these costs apply to a specific network.
Looking at the total cost of the overlay and its impact on a network’s total cost of ownership creates the most apples-to-apples comparison between service providers. (Particularly with a number of pricing models currently in the market.)
For this level of analysis, we created a hypothetical network based on our median WAN Cost Benchmark customer, along with some input from our WAN Manager Survey that queried IT infrastructure managers from around the world about their network configurations.
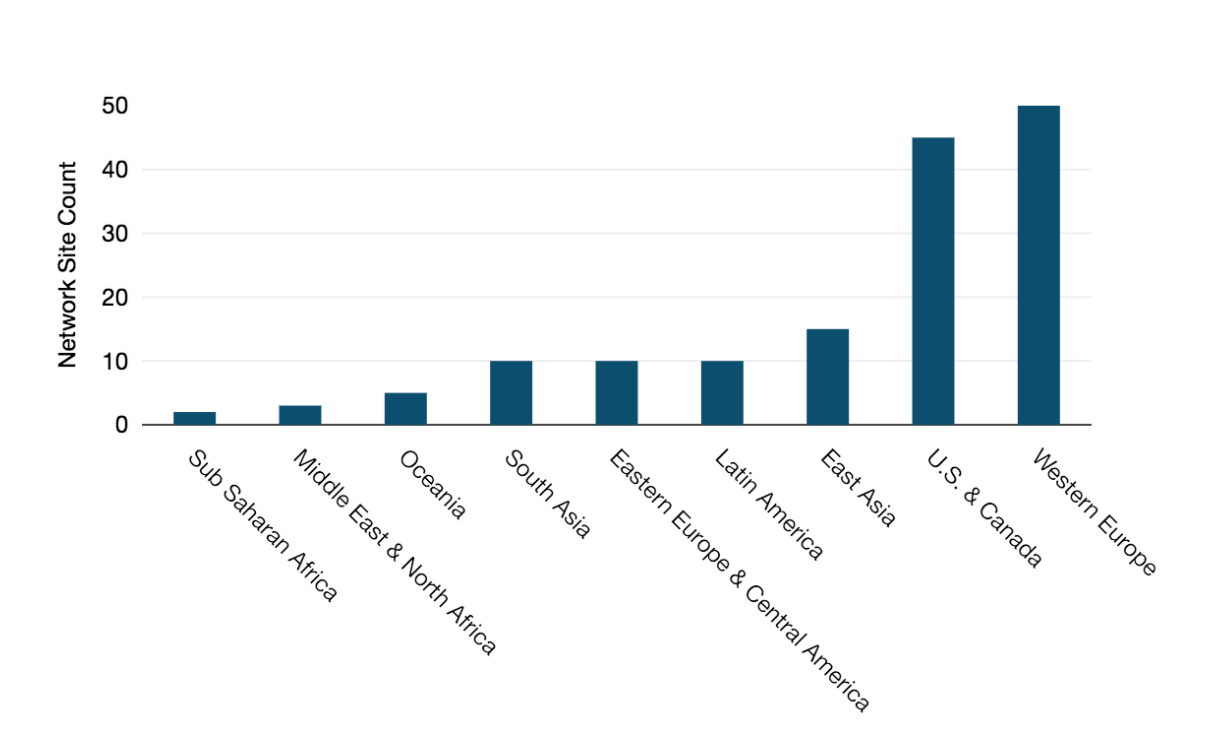
The resulting hypothetical network is 150 sites spread across major international business centers.
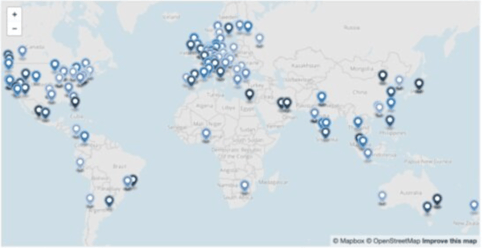
This map from our WAN Cost Benchmark tool gives a clear picture of how our hypothetical network is distributed. And the chart below provides the number of sites in each subregion.
Hypothetical Network Map
Hypothetical Network Site Count by Subregion
The original 150-site network runs MPLS at 140 sites, DIA at 25, and business broadband at 15. So, 10 sites have no MPLS, and a few sites already have internet in addition to MPLS.
The most typical port/circuit speeds are in the 11-50 Mbps range. Many of those are 20 Mbps. The next largest group is 5-10 Mbps.
Our hypothetical network includes dual access lines of the same capacity for each MPLS site and a second passive MPLS port charged at 50% of the median MRC.
Now, let's get to the scenarios.
All Internet WANs With SD-WAN
One of the key selling points for SD-WAN is that it allows enterprise customers to move to a hybrid network design. Adopters can integrate DIA and broadband alongside MPLS without sacrificing performance and security.
Our first scenario focuses on an all internet WAN. We’ve removed MPLS entirely and opted for an SLA-protected DIA and business broadband hybrid. With an SD-WAN overlay, we’ve removed the need for backups as well.
The figure below breaks down the original network scenario total cost of ownership (far left bar) and compares it with three SD-WAN overlay options: unmanaged SD-WAN, basic managed SD-WAN, and premium managed SD-WAN.
Original MPLS & On-Net DIA Broadband Hybrid WAN with SD-WAN Annual TCO, 2020
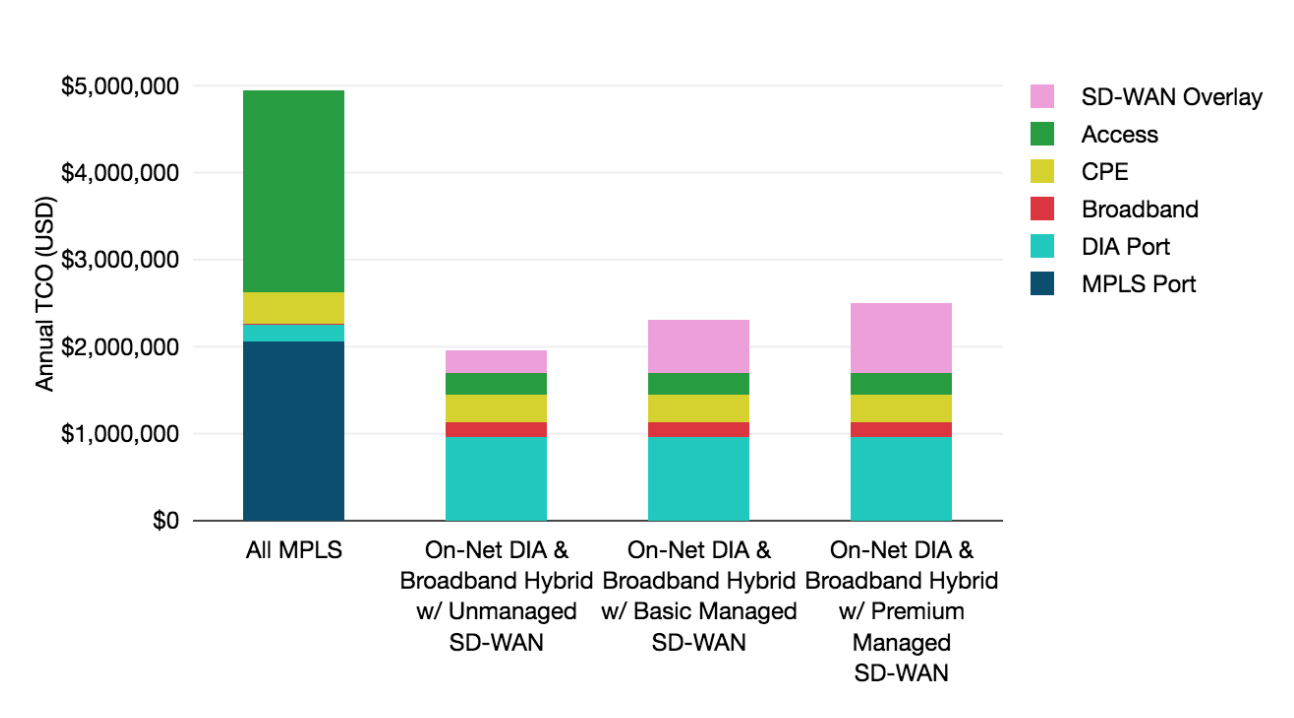
- The cost of our on-net DIA and broadband hybrid network with an unmanaged SD-WAN overlay is $1,957,501. That’s 60% less than the annual total cost of ownership of the starting all MPLS WAN (far left bar).
- The annual total cost of ownership of the on-net DIA and broadband hybrid network with a basic or premium managed SD-WAN service is 53% and 49% less, respectively, than the original all MPLS WAN.
- Opting for a managed SD-WAN service certainly results in network savings, but also increases the cost of the overlay. The cost of a basic managed SD-WAN service in this scenario is 2.4 times more than an unmanaged service, while a premium managed service results in an increase of 3.1 times.
So how does the price of our SD-WAN overlay in this scenario compare to previous years?
The cost of the unmanaged SD-WAN overlay for our on-net DIA and broadband hybrid network decreased 15% compared to 2019. Likely a reflection of the competitive price convergence amongst vendors we discussed earlier.
The cost of the managed SD-WAN overlays actually increased (11% and 10% for basic and premium), but this is largely due to a number of new market players in the data set rather than price increases from individual providers.
You can explore all of TeleGeography’s WAN content over here.


Elizabeth Thorne
Elizabeth Thorne was formerly a Senior Research Analyst at TeleGeography. Her work was focused on enterprise network research.