


To provide insight into how a complete SD-WAN overlay can impact total network spend, it’s useful to look at how various cost components apply to a specific network.
Looking at the total cost of the overlay and its impact on a network’s total cost of ownership (TCO) affords the most apples-to-apples comparison between service providers, particularly with a number of pricing models currently in the market.
To do this level of analysis, we created a hypothetical network based on our median WAN Cost Benchmark customer.
We created a hypothetical network based on our median WAN Cost Benchmark customer.
We also included some input from our WAN Manager Survey, which queries IT infrastructure managers from around the world about their network configurations.
The resulting hypothetical network is 150 sites spread across major international business centers.
The Network
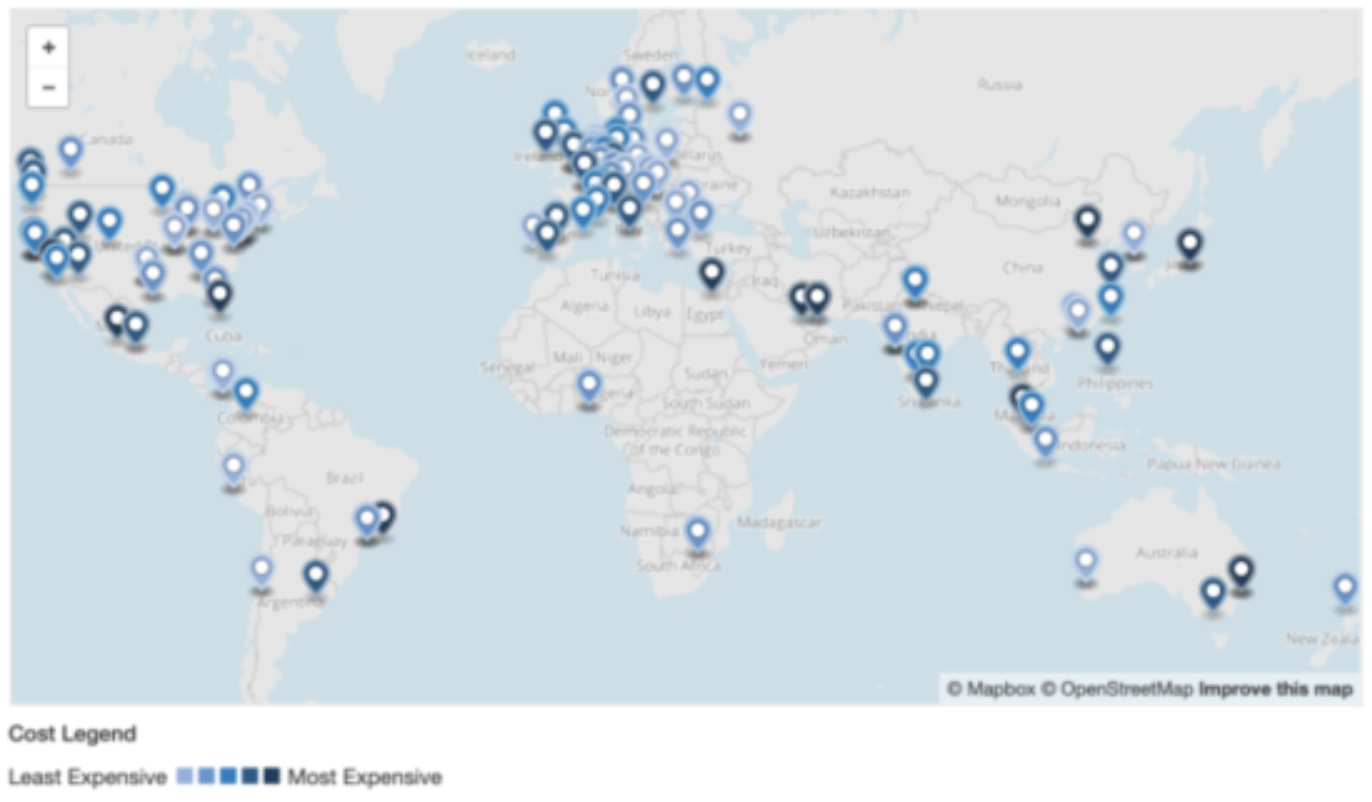
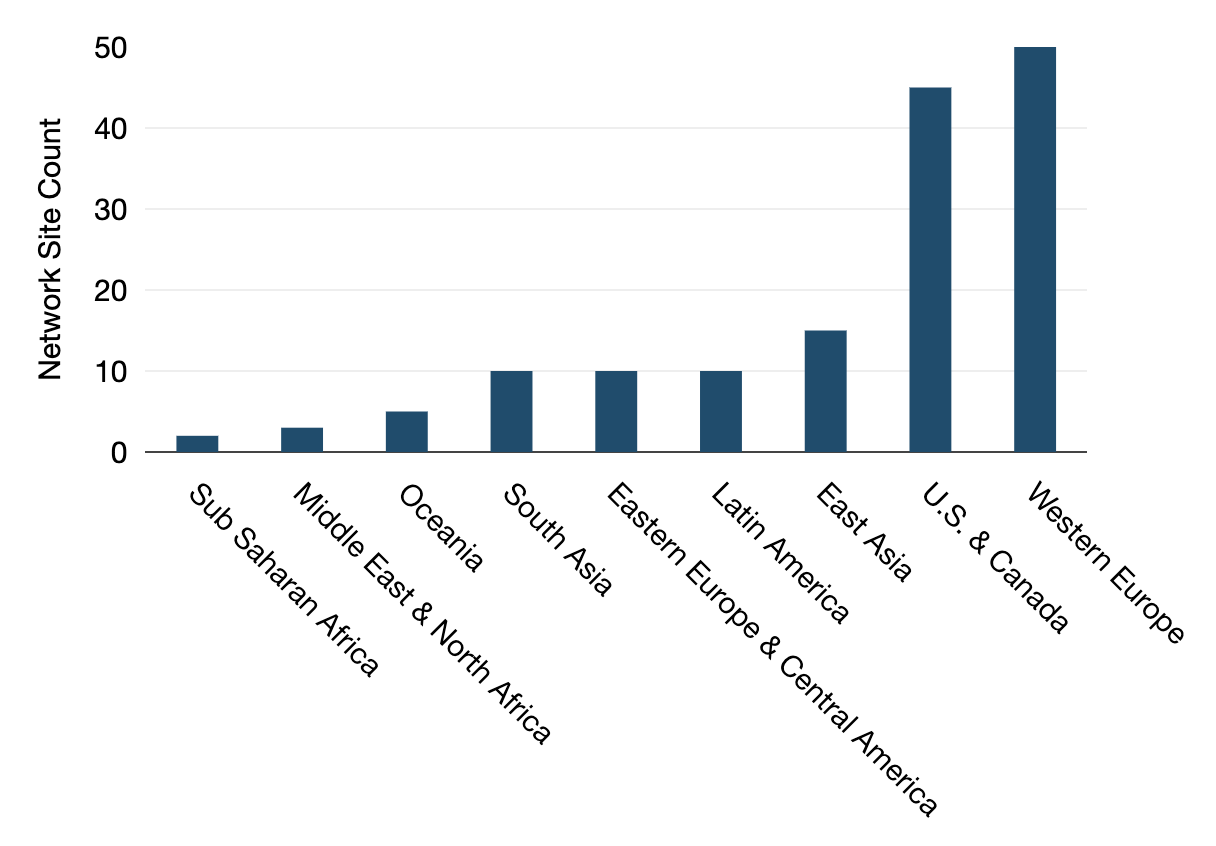
This map from our WAN Cost Benchmark tool gives a clear picture of how our hypothetical network is distributed. The chart below provides the number of sites in each subregion.
Hypothetical Network Map
Hypothetical Network Site Count by Subregion
The original 150-site network runs MPLS at 140 sites, DIA at 25, and business broadband at 15. So, 10 sites have no MPLS, and a few sites already have internet in addition to MPLS.
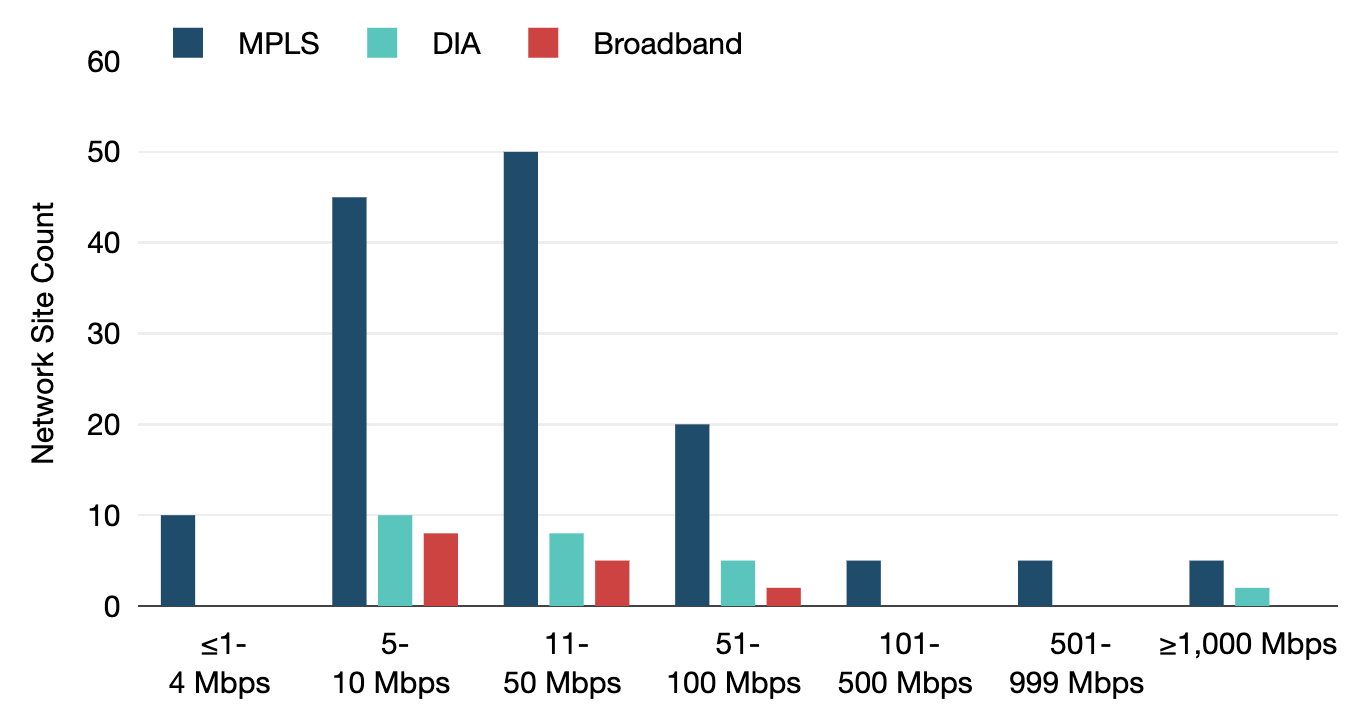
The most typical port/circuit speeds are in the 11–50 Mbps range. Many of those are 20 Mbps. The next largest group is 5–10 Mbps.
Hypothetical Network Site Count by Capacity Range
Finally, how we account for resilience. Our hypothetical network includes dual access lines of the same capacity for each MPLS site and a second passive MPLS port charged at 50% of the median MRC.
All Internet WANs with SD-WAN
Use of the internet in corporate WANs is quickly growing, with the average network running DIA at a reported 42% of sites and broadband at around one-quarter of sites, according to the results from our latest WAN Manager Survey.
One of the key selling points for SD-WAN is that it allows enterprise customers to move to a hybrid network design that leverages these internet services without sacrificing performance and security. So our first scenario focuses on an all-internet WAN.
Our first scenario focuses on an all-internet WAN.
We’ve removed MPLS entirely and opted for an SLA-protected DIA and business broadband hybrid. With an SD-WAN overlay, we’ve removed the need for backups as well.
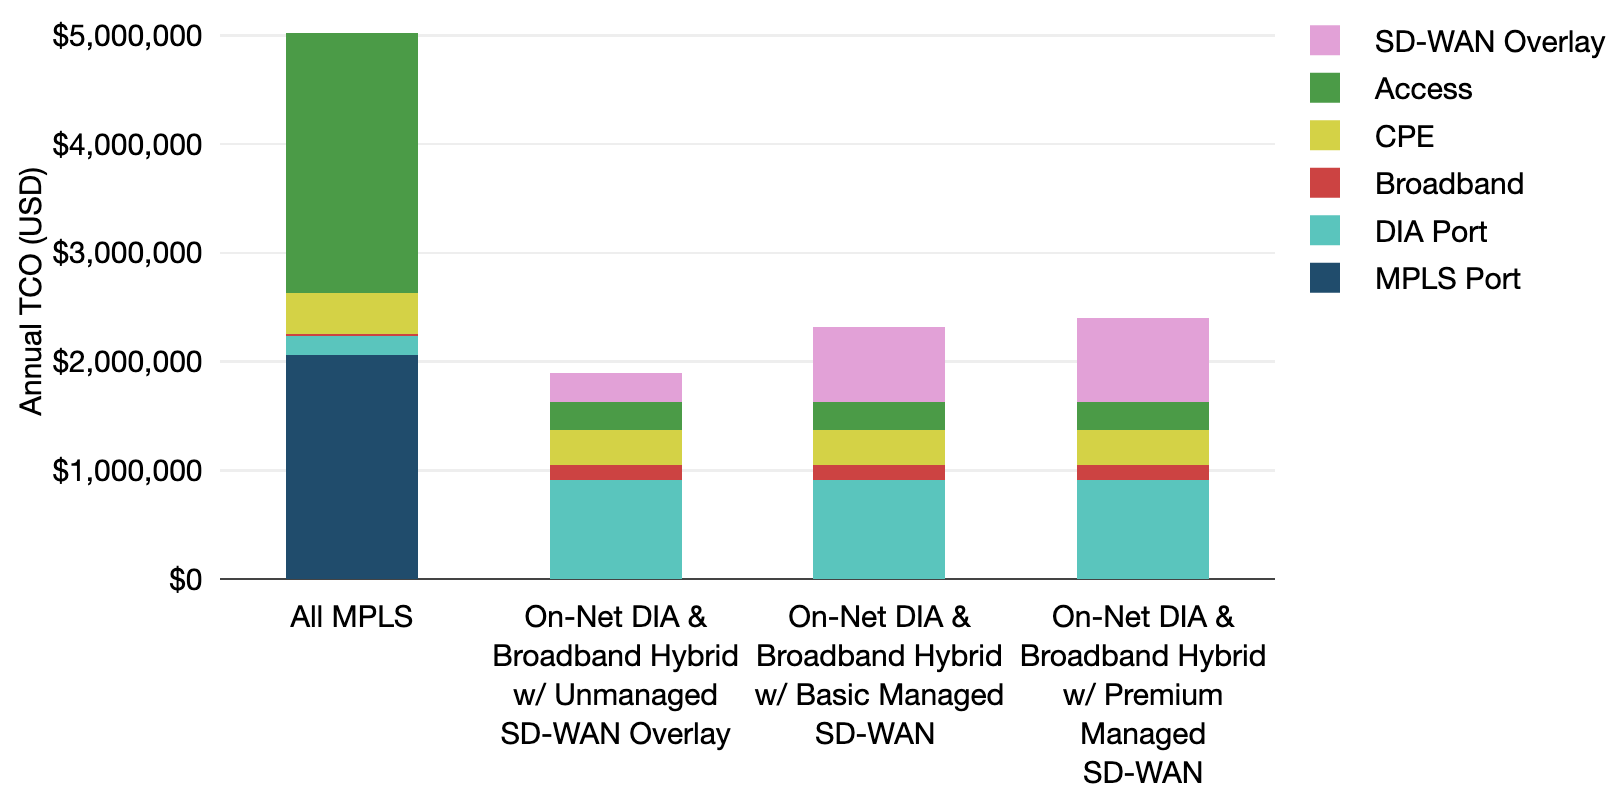
The figure below breaks down the original network scenario TCO (far left bar) and compares it with three SD-WAN overlay options: unmanaged SD-WAN, basic managed SD-WAN, and premium managed SD-WAN.
Original MPLS & On-Net DIA Broadband Hybrid WAN with SD-WAN Annual TCO, 2021
 Source: TeleGeography, © 2022 TeleGeography
-
The cost of our on-net DIA and broadband hybrid network with an unmanaged SD-WAN overlay is $1,891,711. That’s 62% less than the annual total cost of ownership of the starting all-MPLS WAN (far left bar).
-
The annual total cost of ownership of the on-net DIA and broadband hybrid network with a basic or premium managed SD-WAN service was 54% and 52% less, respectively, than the original all-MPLS WAN.
-
Opting for a managed SD-WAN service certainly results in network savings, but does increase the cost of the overlay. The cost of a basic managed SD-WAN service in this scenario was 2.6 times more than an unmanaged service, while a premium managed service resulted in an increase of 2.9 times.
So how does this compare to when we’ve run this scenario in previous years?
-
The cost of the unmanaged SD-WAN overlay for our on-net DIA and broadband hybrid network decreased 14% compared to 2019 (the first year we ran this scenario). This is likely a reflection of the competitive price convergence amongst vendors.
-
The cost of the managed SD-WAN overlays actually increased (23% and 5% for basic and premium), but this is largely due to the sheer number of new managed service providers in the data set rather than price increases from individual providers.
-
Unsurprisingly, the total cost of the network in all three instances has decreased since 2019. The biggest difference was seen for the network that included an unmanaged SD-WAN overlay, with TCO decreasing 9% compounded annually over the past two years. This was followed by the TCO for the network with a premium managed overlay (-6%) and then the network that included a basic managed SD-WAN overlay (-4%).
Hybrid Networks with MPLS and SD-WAN
While the use of internet services is certainly growing, MPLS hasn’t been completely displaced just yet. The service still represented the largest plurality (46%) of network sites in our latest WAN Manager Survey. Our second scenario takes this into account and looks at an MPLS and on-net DIA hybrid network with no MPLS backup.
Our second scenario looks at an MPLS and on-net DIA hybrid network with no MPLS backup.
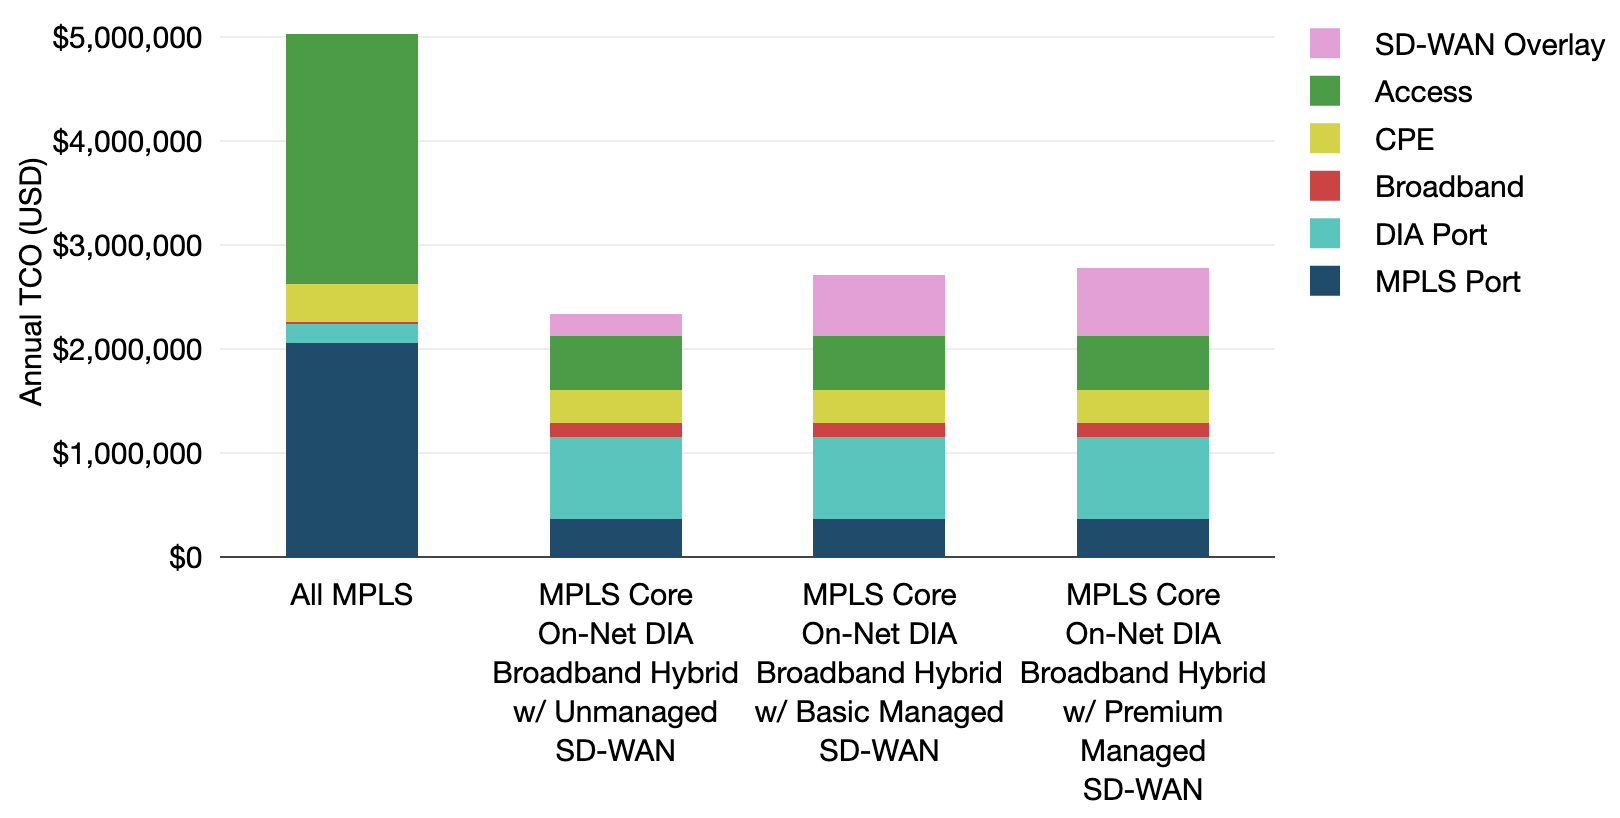
Looking at the figure below, we see that even when keeping MPLS at key sites that do need class of service assurances, overall network savings can be achieved.
Original MPLS & MPLS On-net DIA Hybrid WAN with SD-WAN Annual TCO, 2021
-
Our MPLS core with on-net DIA WAN with unmanaged SD-WAN is $2,339,324 annually, 53% less than the original all-MPLS WAN (far left bar). The cost of just the unmanaged SD-WAN overlay itself was 29% less than in 2019 when we first ran this scenario—the biggest cut in the cost of an overlay we saw.
-
Managed SD-WAN services afforded similar total network savings. While the cost of the SD-WAN overlay itself increased 2.7 times for a basic managed service and 3.1 times for a premium managed service, both represented a 44% and 41% cut in the annual total cost of ownership. So even with the increase in price associated with managed SD-WAN services, if you are able to reduce underlying network costs, overall network savings can be achieved.
-
Once again, the total cost of the network for all three SD-WAN scenarios decreased over the past three years (an average of 7% compounded annually). The network featuring an unmanaged SD-WAN overlay exhibited the biggest decline (-8%), followed by the premium managed SD-WAN network (-7%), and finally the basic managed SD-WAN network (-5%).
The motivation to adopt SD-WAN focuses on performance enhancement, but enterprise customers are not immune to cost. And the price of an individual SD-WAN service remains a point of consideration.
As our hypothetical scenarios show, regardless of whether an enterprise adopts a managed or unmanaged SD-WAN solution, incorporating SD-WAN alongside MPLS, DIA, and broadband can lead to overall network savings.
Additional details on this hypothetical network and more can be found in the WAN Cost Benchmark.


Brianna Boudreau
Senior Research Manager Brianna Boudreau joined TeleGeography in 2008. She specializes in pricing and market analysis for wholesale and enterprise network services with a regional focus on Asia and Oceania. While at TeleGeography, Brianna has helped develop and launch several new lines of research, including our Cloud and WAN Research Service.