The network faced a host of new demands and challenges in 2020, but many of the key trends that characterized the wholesale market prior to the pandemic held true.
Demand growth remains robust. And while the pace of price erosion moderated in many markets over the past year, prices still continued to decline.
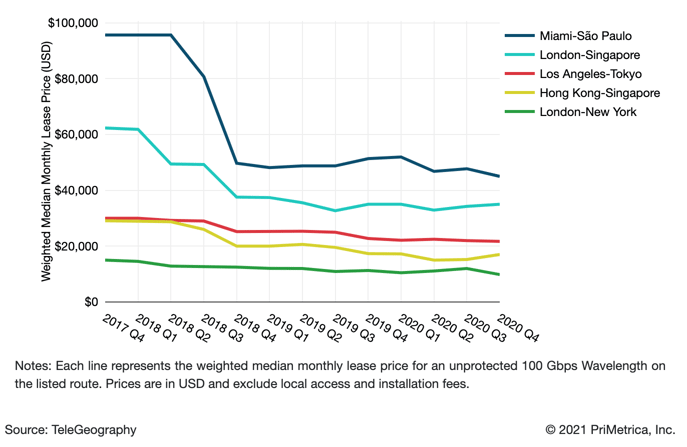
Between 2017 and 2020, weighted median 100 Gbps wavelength prices across key global routes decreased an average of 16% compounded annually.
The average decline across these routes slowed to 6% between 2019 and 2020, a reflection of different levels of market maturity as well as delays in supply due to both geopolitical challenges and supply chain issues stemming from COVID-19.
Weighted Median 100 Gbps Wavelength Price Trends on Major International Routes

Prices for 100 Gbps on the core Los Angeles-Tokyo and London-New York routes fell the least, just 10% and 13% compounded annually since 2017.
Wavelength prices on both routes are already extremely competitive and don’t have as much room to fall.
But for the Pacific, this was a notable slowdown from previous years. In comparison, the U.S.-Latin America route is still feeling the effects of new cables and upgrades to existing systems after years of scant competition. The weighted median 100 Gbps price on Miami-São Paulo fell the most, 22%. And while the trend lines might look a little flat on some of the other routes in between, prices are still eroding at a steady clip across most global routes.
As 100 Gbps price erosion has outpaced that of the more mature 10 Gbps, it has compressed price multiples between the two services. And this has made it much more economical for customers to upgrade their networks in anticipation of future growth—particularly in 2020 as regional providers reported increased demand for higher capacities as a result of the COVID-19 pandemic.
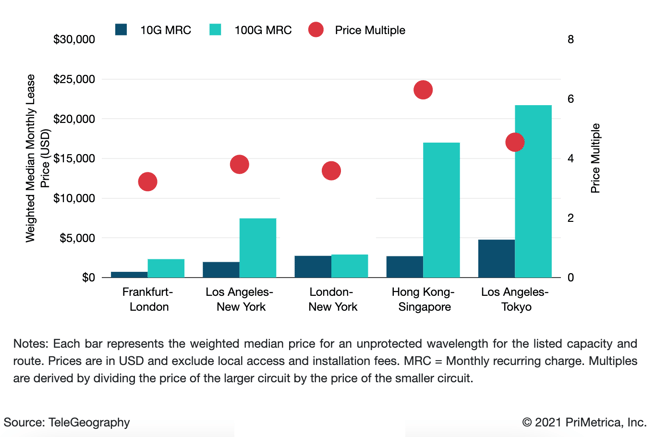
In Q4 2020, carriers priced 100 Gbps wavelengths an average of 4.3 times higher than 10 Gbps for 10 times the capacity. That's down from 6.4 times more in 2015.
10 Gbps and 100 Gbps Wavelength Weighted Median Prices and Multiples on Select International Routes

Multiples vary by route, corresponding with regional price differences. Shorter, intra-regional terrestrial links exhibit lower price multiples than longer, transoceanic subsea connections. For example, in the accompanying figure, you can see that Frankfurt-London and Los Angeles-New York report some of the lowest price multiples of the group.
We also tend to see low multiples where 100 Gbps adoption is strong since this drives down unit cost, or in markets where 10 Gbps prices are still high.
You can see that London–New York has the lowest multiple amongst the subsea routes featured here for two reasons: 100 Gbps prices are low on this route, and sales of 10 Gbps circuits have stalled, resulting in more stable prices. The same goes for Los Angeles-Tokyo.
And while the price multiple on Hong Kong-Singapore might look high (at 6.3), carriers who offer both 10 Gbps and 100 Gbps service on the route reported an average price multiple of 4.7. This falls much closer to other core subsea routes and speaks to the sizable 100 Gbps market on the key intra-Asia connection.
There's more like this in our freshly updated executive summary.
For full access to the datasets, search tools, downloadable resources, and extended analysis in the Global Bandwidth Research Service, email our team at info@telegeography.com.
Brianna Boudreau
Senior Research Manager Brianna Boudreau joined TeleGeography in 2008. She specializes in pricing and market analysis for wholesale and enterprise network services with a regional focus on Asia and Oceania. While at TeleGeography, Brianna has helped develop and launch several new lines of research, including our Cloud and WAN Research Service.


