We have one more surprise to roll out before 2021 draws to a close.
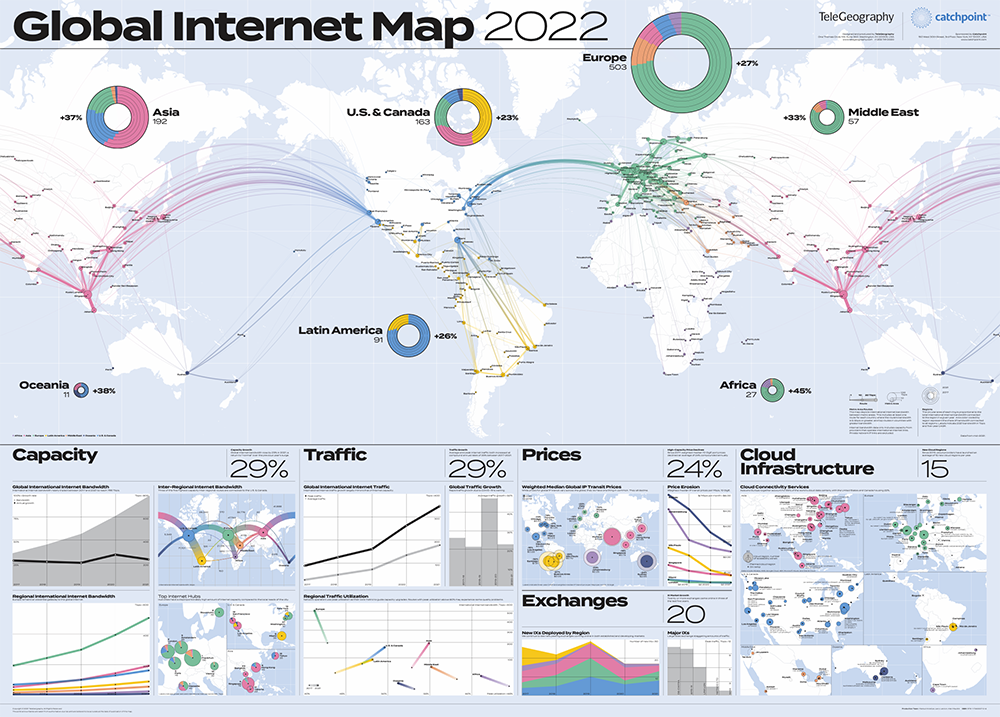
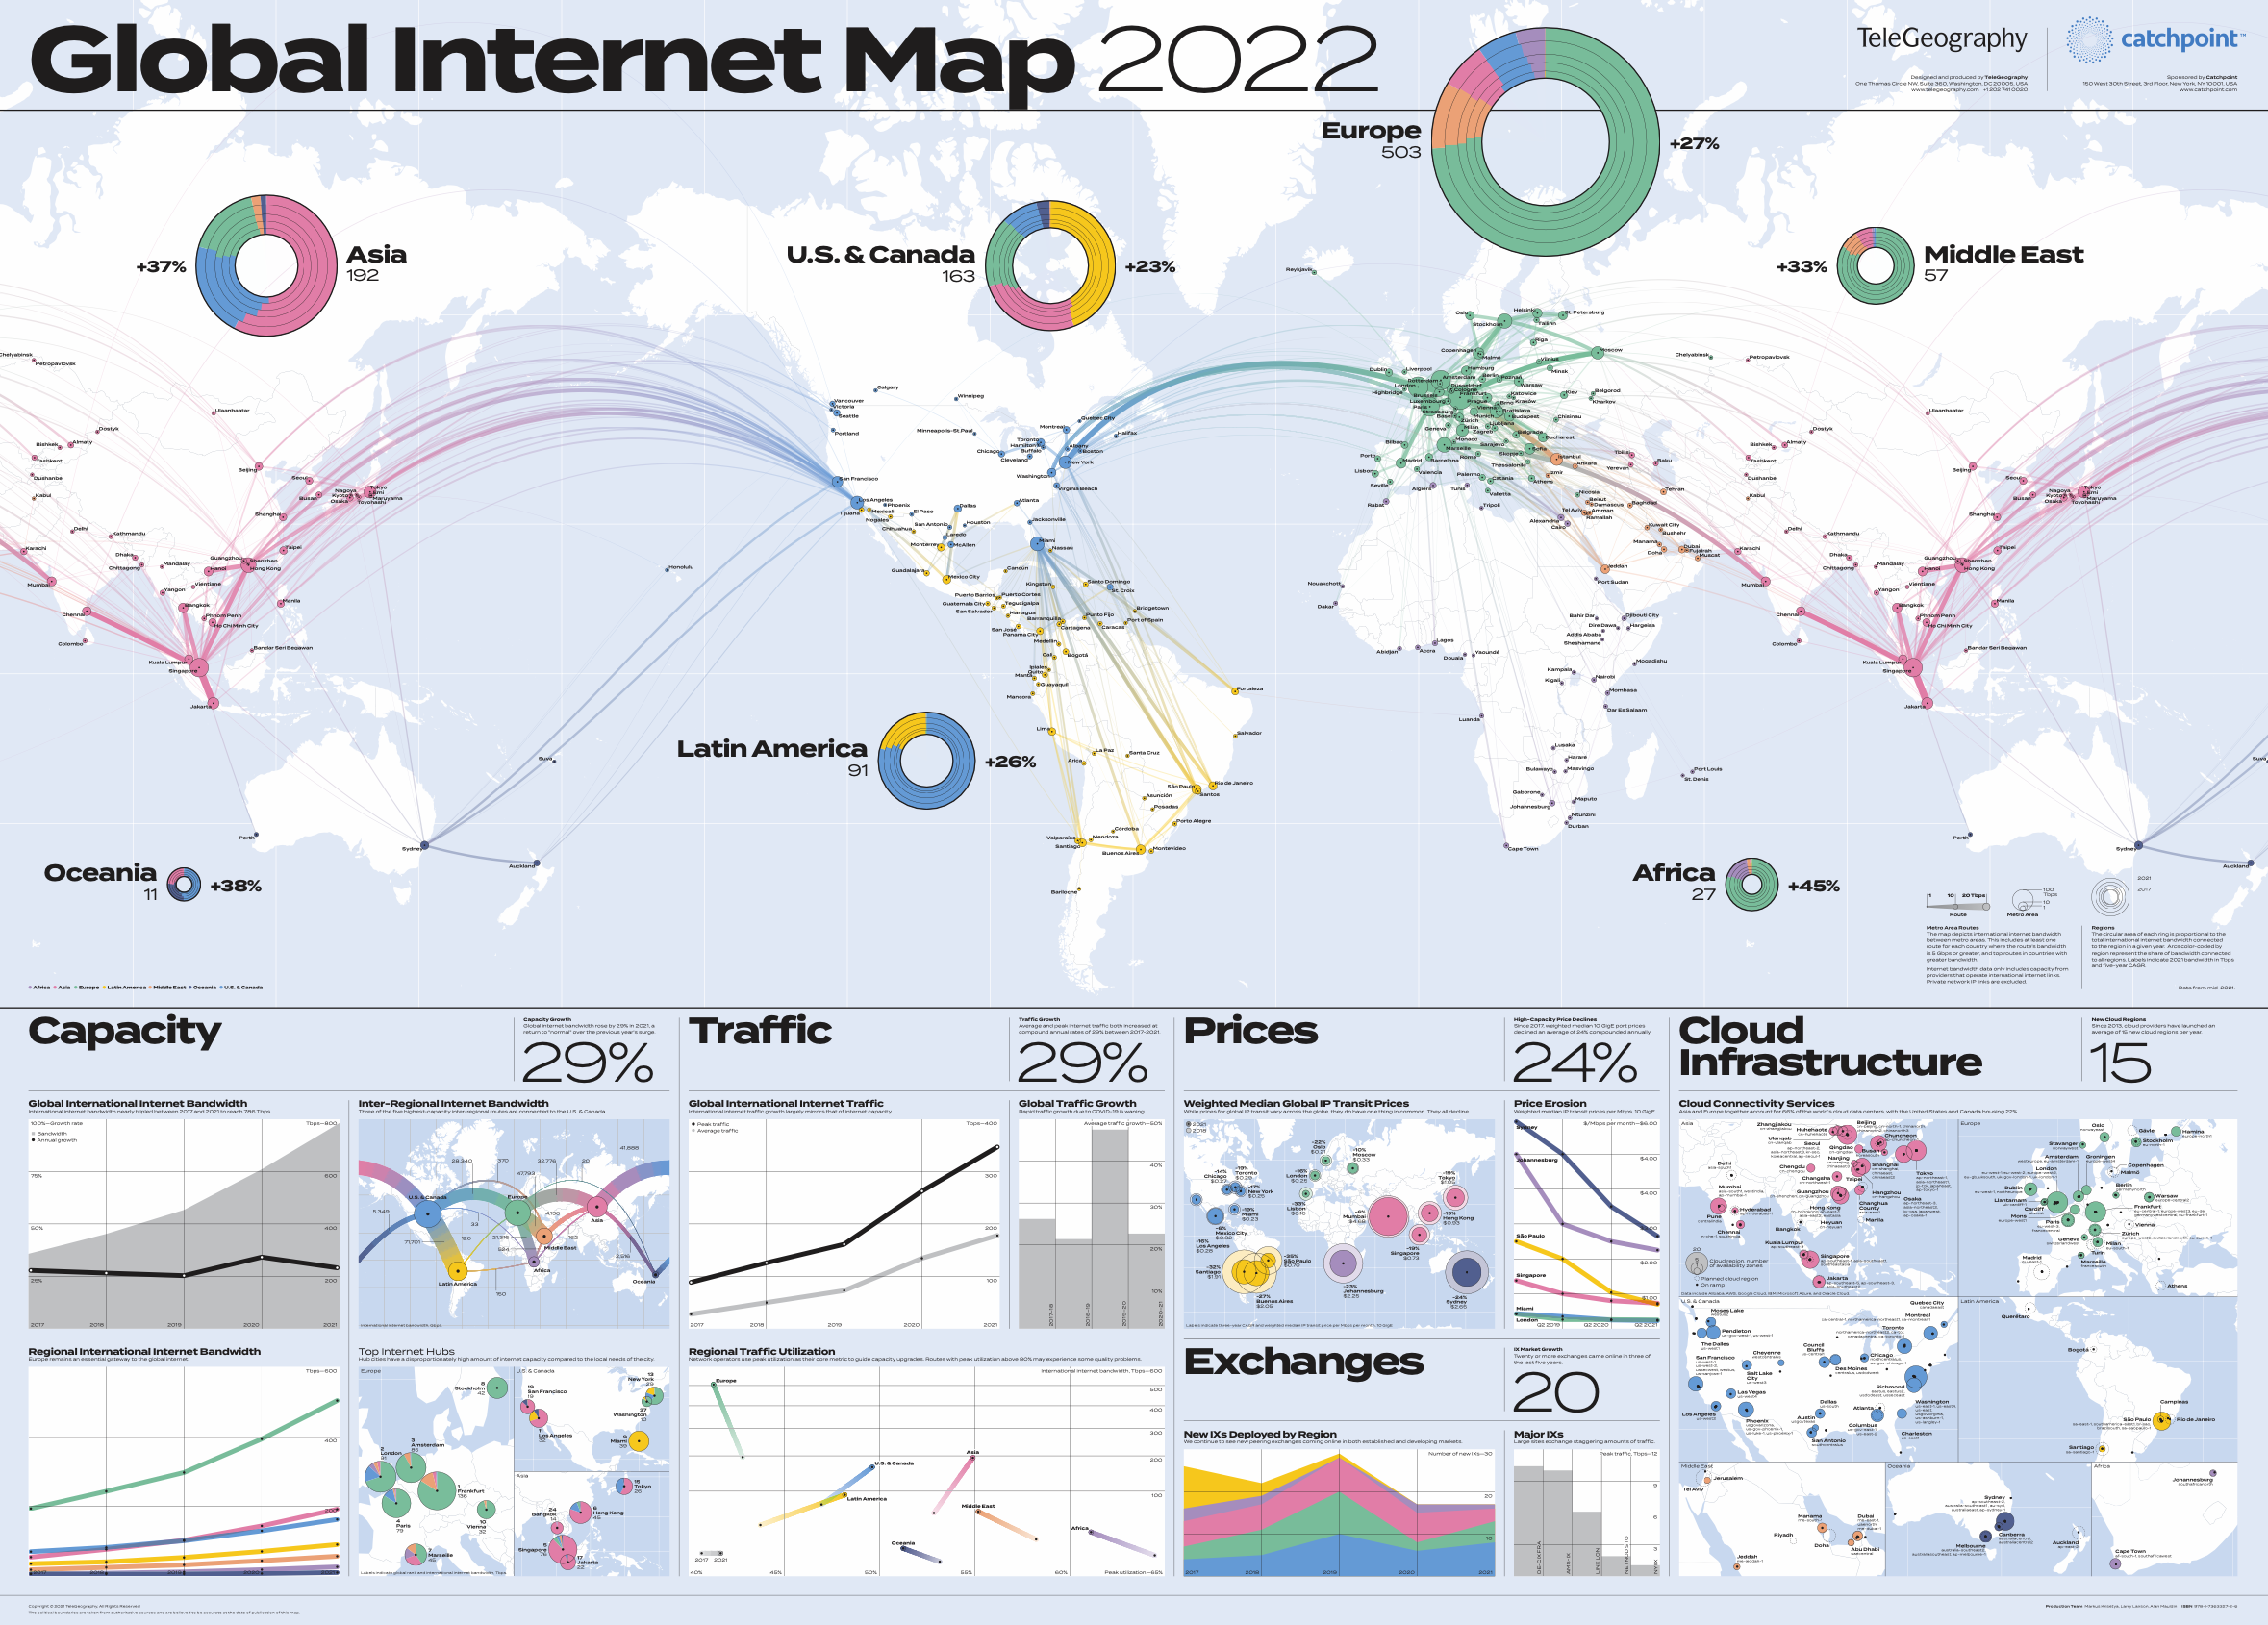
Say hello to our 2022 Global Internet Map!
There's a lot to unpack in this latest edition, sponsored by the team at Catchpoint. Here's just a few that stick out to us.
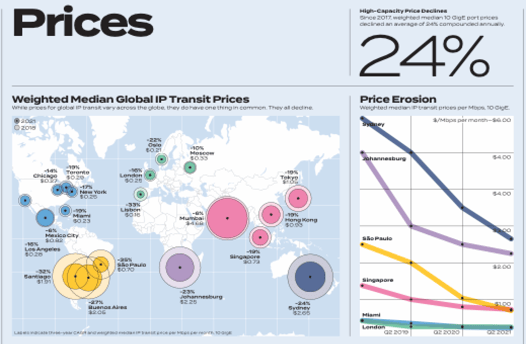
Pricing Particulars

What do this year's pricing infographics show us? To start, across a range of markets, 10 GigE prices fell 18% CAGR 18-21.
Yes, prices vary by market, but they do have one thing in common: they all decline
International Internet Capacity, Explained
Naturally, our internet map tells us a lot about the internet. Here are a few fun facts illustrated in our new edition:
- Global internet bandwidth stands at 786 Tbps with a four-year CAGR of 29%.
- Average and peak international internet traffic increased at 29% CAGR, same as internet bandwidth.
- Here's something to note: the COVID effect is waning. And we're seeing a return to more "normal" usage patterns. This resulted in a substantial slowdown in the annual growth rate.
- When it comes to inter-regional bandwidth, three of the five highest capacity inter-regional routes are connected to the U.S. and Canada. (Latam-U.S. & Canada, Asia-U.S. & Canada, and Europe-U.S. & Canada)
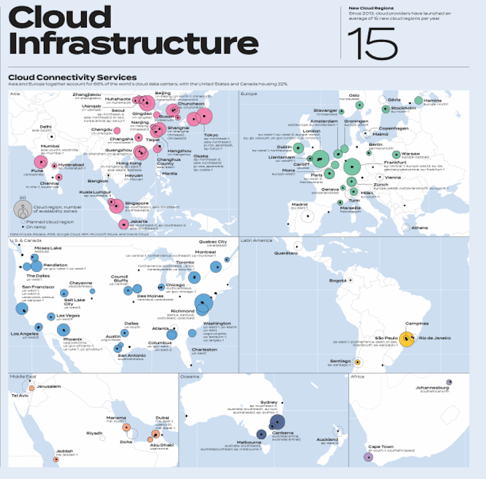
Cloud Considerations

Chew on this: since 2013, cloud providers have launched an average of 15 new cloud regions per year.
And it doesn't necessarily look like this is slowing down anytime soon. We see a lot of new activity for planned cloud regions in the Middle East and Latin America. Watch this space.
Thank you to Catchpoint for sponsoring the 2022 Global Internet Map.
You can purchase a copy for your wall in our map store or peruse our online edition over here.
Anahí Rebatta
Anahí is a Senior Analyst at TeleGeography. As part of the infrastructure team, she heads the Global Internet Geography research service. Her regional focus is on Latin America and the Caribbean.


