


Back in 2019, we built a hypothetical network to illustrate how different network configurations might affect total cost of ownership (TCO).
Now that it's nearly 2023, we got to thinking, if Cheaper By the Dozen can get a reboot, why can't our hypothetical network series?
So here we are. The world has changed a lot in the last three years, and WAN managers are also facing a number of changes.
The shift toward cloud applications requires increased bandwidth and integration of local internet breakouts to ensure application performance. Managers must also accommodate a larger portion of the workforce that is now at least partially remote, ensuring they have access to sensitive company data and applications.
All this within budget constraints that haven’t exactly increased at the same pace as other requirements. As a result, network architects must consider implementing creative hybrid WAN solutions.
This blog series dives into some of the approaches that WAN managers might take to balance performance and cost considerations.
This blog series dives into some of the approaches that WAN managers might take to balance performance and cost considerations. It combines our enterprise port and SD-WAN overlay pricing data and applies it to scenarios we’ve seen WAN managers consider to illustrate how these strategies can impact network costs.
About Our Network
In order to model different network scenarios, we created a hypothetical network based on our median WAN Cost Benchmark customer. We also incorporated some input from our WAN Manager Survey that queried IT infrastructure managers from around the world about their network configurations.
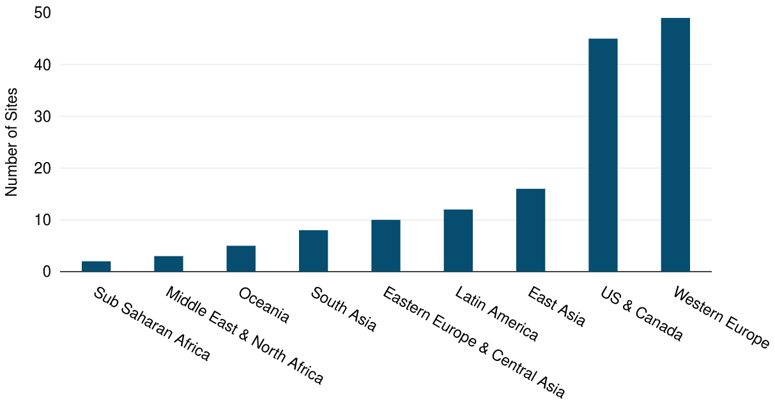
Our hypothetical network is 150 sites spread across Africa, Asia, Europe, Latin America, the Middle East, Oceania, and the U.S. and Canada. We’ve also included seven data center sites spanning Asia, Europe, and the U.S.
The map below provides a snapshot of our hypothetical network. The chart provides the number of sites in each subregion.
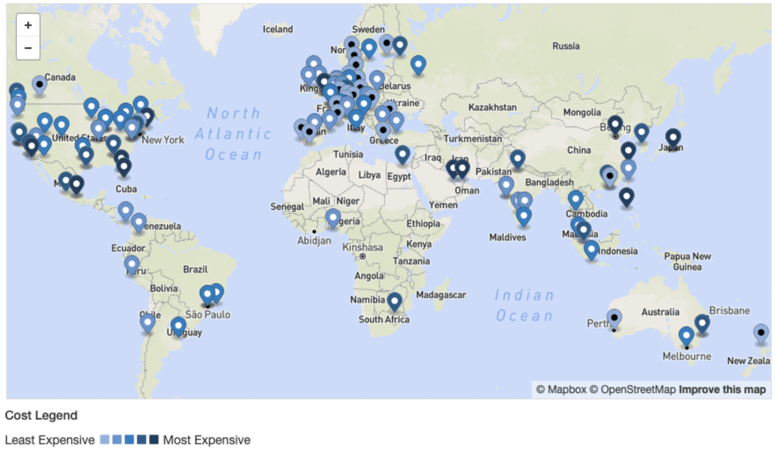
Hypothetical Network Site Count by Subregion
Original Dual MPLS Network
Our starting hypothetical network represents where many enterprises are today–just starting out on their network transformation journey. Many are still running an all-MPLS network and have not yet adopted SD-WAN.
As such, our original 150-site network runs a dual MPLS WAN with a fully redundant access line and active MPLS backup at each site. The seven data center sites are still on the MPLS network, but with no backup. No SD-WAN overlay has been deployed.
We have set MPLS class of service (CoS) levels to 10% voice/video, 30% real-time data, and 60% best efforts, which is typical of our customers’ average sites.
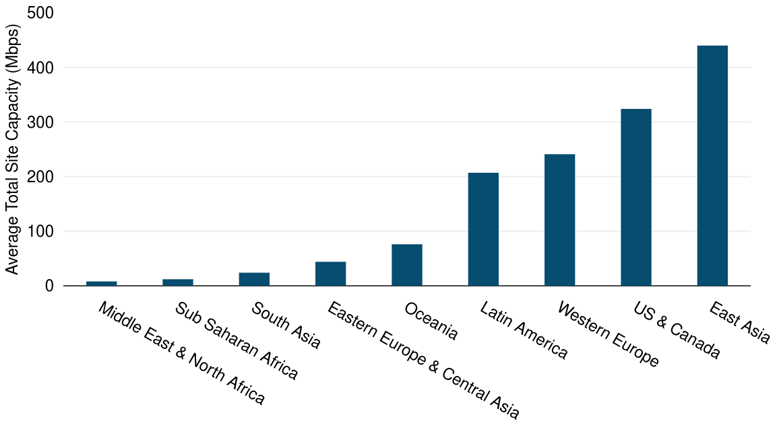
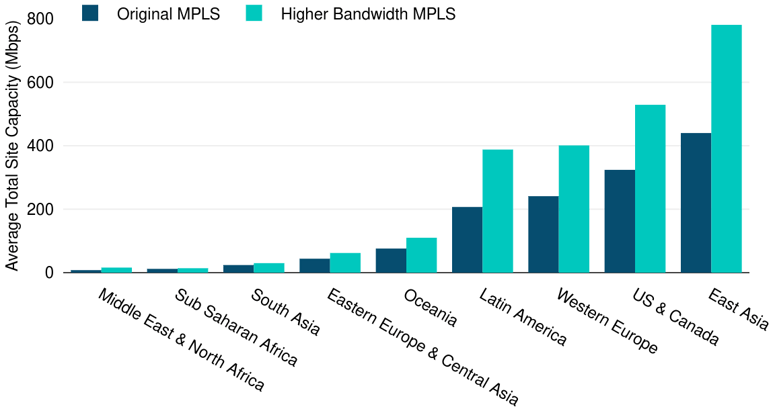
The figure below shows the average Mbps across all sites in each subregion. Globally, the average total site bandwidth in our original network is 246 Mbps. The highest capacities are found in East Asia, the U.S. and Canada, and Western Europe, mostly due to the presence of data centers in those regions.
Dual MPLS Average Site Capacity by Subregion
 Source: TeleGeography
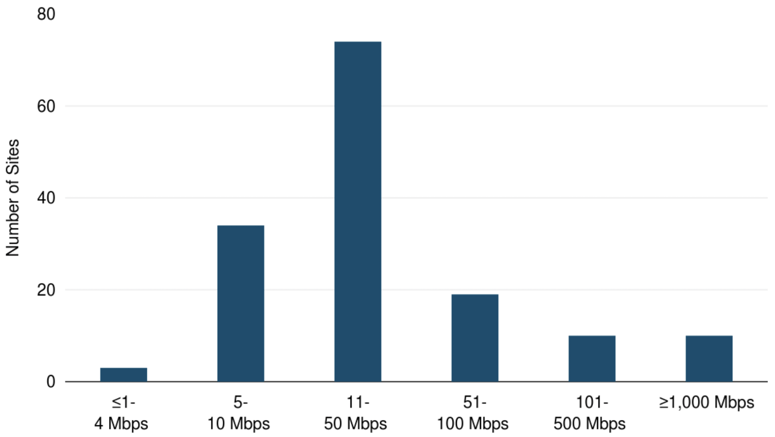
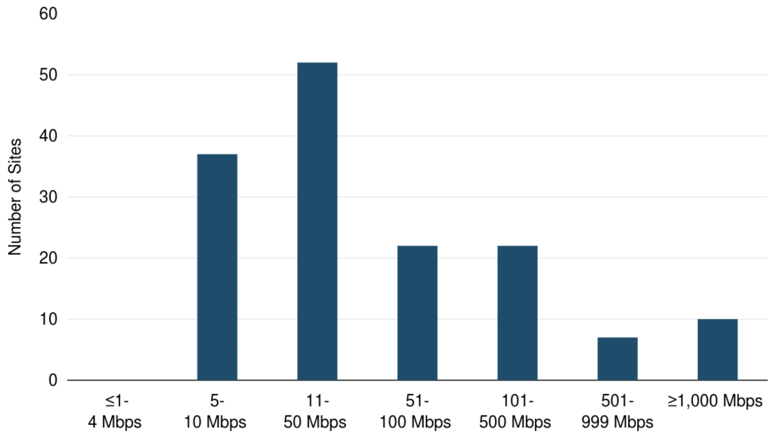
The most typical port/circuit speeds are in the 11-50 Mbps bandwidth range, a common MPLS port size range according to our WAN Manager Survey and benchmarking customers.
The next largest is 5-10 Mbps, followed by 51-100 Mbps. There are a few small capacity sites at 4 Mbps or below meant to represent very expensive markets and a few high-capacity sites representing our headquarters or data center sites.
Dual MPLS Network Site Count by Capacity Range
In Q2 2022, the annual TCO for our original dual MPLS WAN was $6,241,908.
Now that we have our baseline network set, let’s dive into our first scenario.
High Bandwidth MPLS Network
Today’s WAN requires a lot more bandwidth, especially as people return to the office with a host of bandwidth hungry UCaaS applications in tow.
Our first scenario looks at what accommodating escalating bandwidth requirements without changing our approach to network architecture would cost.
Our first scenario looks at what accommodating escalating bandwidth requirements without changing our approach to network architecture would cost.
The resulting high-bandwidth MPLS network once again runs a dual MPLS WAN with a fully redundant access line and active MPLS backup at each site.
In this scenario, however, we’ve boosted our bandwidth by at least 50% in all but the most challenging markets. The resulting average total site bandwidth is 414 Mbps, 68% more than our original MPLS network at an average of 246 Mbps.
As you can see in the figure below, much of the capacity increase was in East Asia, the U.S. & Canada, and Western Europe where a bulk of our higher capacity sites and data centers are located.
Dual & Higher Bandwidth MPLS Network Site Capacity by Subregion
 Source: TeleGeography
While the majority of our network sites are still in the 11-50 Mbps bandwidth range, we can see the port size distribution has shifted slightly to the right and the number of sites in higher capacity ranges has increased.
High Bandwidth MPLS Network Site Count by Capacity Range
Unsurprisingly, the price has gone up significantly. Looking at the figure below, our high bandwidth MPLS network is 19% or $1,205,232 more annually than our original MPLS network for a 68% increase in bandwidth.
Dual MPLS & High Bandwidth MPLS WAN Annual TCO
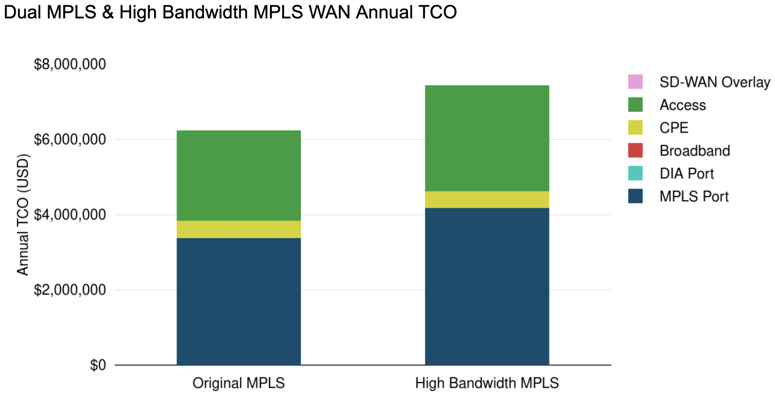
The biggest takeaway here is that while there are some noticeable unit cost savings, without changing our approach to network design, boosting MPLS capacity leads to a significant price increase. And that isn’t sustainable for a majority of corporate networks.
So what are the alternatives?
Over the next few weeks we’ll run through a number of hypothetical network scenarios and look at how changing technologies, capacities, and accommodating a remote work force can change our network costs.
Up Next: Tiered Sites Approach
Good news!
This series is now an e-book.
Download your free copy to explore all five of our hypothetical scenarios in one place.

Greg Bryan
Greg is Senior Manager, Enterprise Research at TeleGeography. He's spent the last decade and a half at TeleGeography developing many of our pricing products and reports about enterprise networks. He is a frequent speaker at conferences about corporate wide area networks and enterprise telecom services. He also hosts our podcast, TeleGeography Explains the Internet.