


As the WAN continues to evolve at warp speed, carriers, vendors, and enterprise IT infrastructure teams need to understand how these changes will affect the business of telecom.
That’s where our WAN Market Size Report comes in. With its data-driven model, this tool can provide a granular view down to the country level of the market opportunity for the underlay network or corporate WAN.
Want a sample from our latest report? Just keep reading.
Regional WAN Connectivity Market Sizes
Any active participant in the global WAN market knows that network service pricing varies considerably across different geographies, and that these trends are not uniform by product.
Our WAN Market Size Report model accounts for how these price differences would lead to different bandwidth selections by breaking out each bandwidth distribution into regions.
Customers in less expensive regions, like the U.S. & Canada and Western Europe, use higher bandwidths than the global median. Enterprises with sites in more expensive regions like the Middle East and North Africa typically use lower bandwidths at those locations.
Even having accounted for that, the large spread in prices across regions leads to variable contributions of each region to the global market size, and to stark differences in product revenue across the world.
Regional Contribution to the Global WAN Market Size, 2021
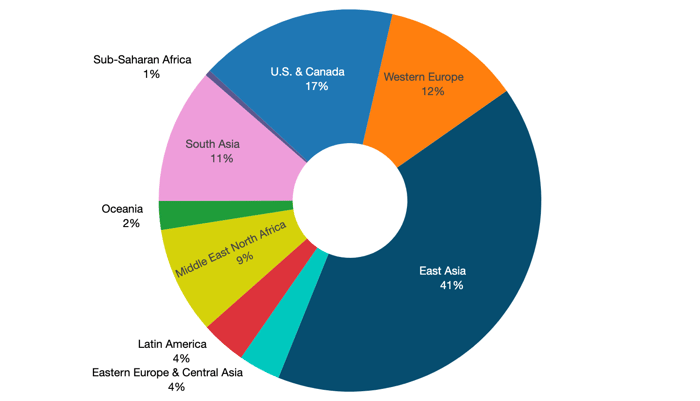
model run for the global market. Source: TeleGeography, © 2022 TeleGeography
- East Asia dominated the global market in WAN revenue in our median model run at 41%—a dollar value of $24 billion. Our model assumes this region to be only 15% of global WAN sites, so the large revenue comes primarily from consistently high prices in parts of the region.
- The U.S. & Canada was the next largest revenue contributor at $9.8 billion, or 17%. This is despite the fact that the region is assumed to represent 30% of global WAN sites.
Country WAN Connectivity Market Sizes
Although our WAN Manager Survey collects geographic data only at the regional level, using data from our WAN Cost Benchmark customers along with population and economic data, we were able to construct assumptions on network footprint geographies down to the country level.
The pricing data we collect is at the metro level, so we are easily able to tease out pricing differences beyond regional granularity. This becomes particularly useful in regions such as East Asia that have a wide variety of development levels and market openness, leading to a large range in network prices across countries.
Total country revenues varied considerably, from a low of less than $100,000 in Rwanda to the $14 billion high in China. It is worth noting as you peruse the map that some countries listed have an incomplete model.
We were not able to collect prices for all services in those countries, so some products show a zero value.
It is not the case that there is zero revenue for these products in any country. However, it is likely an indication that there is not a critical mass of WAN business in those locations in order to have made it into our pricing surveys.
The real values, while likely to be greater than zero, are not likely to change much in terms of relative geographic market size positioning.
Total WAN Revenue by Country, 2021 (USD millions)
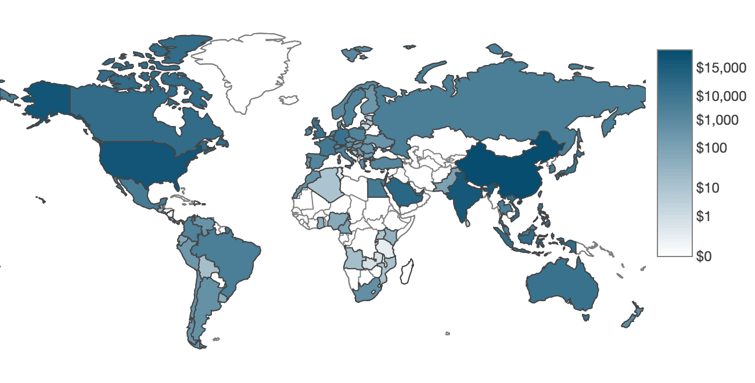 Notes: Country revenues represent the median model run. Prices are in millions of U.S. dollars.
Source: TeleGeography, © 2022 TeleGeography
To continue reading this Executive Summary,
download the full version.


Mei Harrison
Mei Harrison was formerly a Junior Research Analyst at TeleGeography. Her research was focused on WAN.