
The colocation data center sector is characterized by remarkable price stability—remarkable in that such external pressures as a global pandemic, geopolitical uncertainty, and regulatory restrictions have failed to dramatically sway prices in one direction or the other.
To be sure, there are sometimes short-term movements, but over the span of several years, collective rates shift only slowly from their baseline.
Let's delve into the key aspects of colocation pricing.
Colocation pricing models can differ from one provider to the next. In order to address this complexity here, we track specific metrics based on a narrowly-defined scenario in order to ensure relevant comparisons.
Price per Kilowatt
Let's start with a broad assessment of regional price trends over time.
Unlike many of the network services that we track at TeleGeography, the colocation market does not follow a trajectory toward continual price erosion.
Unlike many of the network services that we track at TeleGeography, the colocation market does not follow a trajectory toward continual price erosion. In aggregate, regional average colocation rates remain steady.
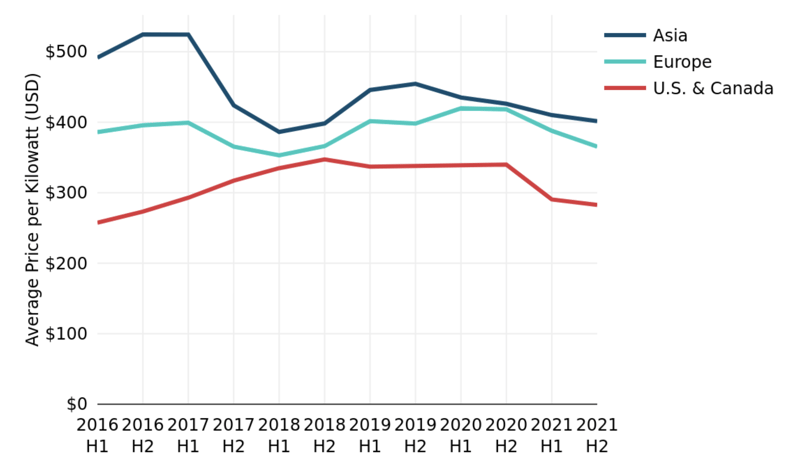
Despite the periodic fluctuations in the line chart below, the only significant regional shift we see is a 6% compound annual contraction in the average price per kilowatt for key Asian metros (measured since H2 2016).
By comparison, long-term changes for our sampling of key U.S. and European markets are negligible. In fact, the slight shifts that are shown can sometimes be attributed simply to sampling changes.
Sampling changes particularly affect the recent decline shown here for Europe, where most operators have reported no pricing change over the past year, with the exception of a few that have actually reported rate increases.
Regional Average Monthly Price per Kilowatt at 4-Kilowatt Density, H1 2016-H2 2021
While overall prices tend to be quite stable, regional averages can differ substantially.
Since we first started tracking colocation pricing in 2013, the average rate in Europe has generally fluctuated between 20% and 30% higher than the average rate in North America.
You'll notice that there was an anomalous narrowing of this gap in 2018, but regional differences have since reverted to the typical trend. Also note that Asia's regional average has dropped to near convergence with Europe's regional average rate but remains slightly higher.
Regional price differences don't always translate to individual markets, but in H2 2021, we had a pretty neat pattern in global hub markets.
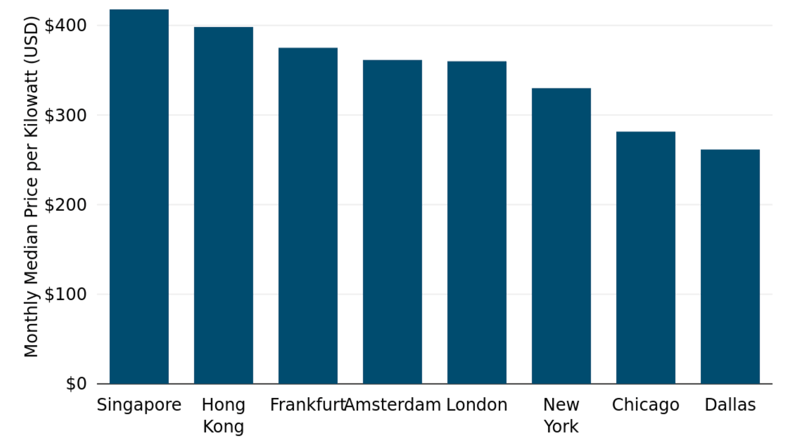
As you can see in the accompanying bar chart, Asian hubs were the priciest, as is typically the case. Both Singapore and Hong Kong hovered around median retail colocation rates of $400 per kilowatt.
But mirroring broader regional trends, our top European metropolitan markets ranked together as the next most-expensive markets, followed by U.S. hubs. In fact, every U.S. market with sufficient data for reporting in H2 2021 registered cheaper median colocation rates than in each of our hub European and Asian markets reporting.
Median Monthly Price per Kilowatt at 4-Kilowatt Density, H2 2021
Drilling down further to intra-regional market comparisons, it's not unusual to find significant and consistent price differences between hub markets within the same region.
Take Frankfurt and Amsterdam, for instance. While both are counted among the biggest telecom and data center hubs in Europe, Frankfurt has been resolutely more expensive—with the exception of near convergence here in H2 2021. This result is affected by sampling changes, but several operators consistently charge more in Frankfurt than in Amsterdam.
The historical price differences between these metros could be seen as an indicator of higher demand and/or higher underlying costs in Frankfurt. But it can also be seen as an opportunity for operators in Amsterdam to compete for regional interconnection demand due to its relative price-competitiveness.
Among other examples, you can find a similar pattern if you compare the East Coast U.S. metros of New York and Washington, D.C.
While we're comparing market trends, what about hub and secondary markets? Do hub colocation rates always come at a premium?
As it turns out, whether a metropolitan market is considered a hub or secondary market doesn't have much of an impact on its pricing.
As it turns out, whether a metropolitan market is considered a hub or secondary market doesn't have much of an impact on its pricing.
In our H2 2021 market sampling, hub markets were, on average, about 10% more expensive than secondary markets. Generally speaking, local competitive dynamics are driven by a lot more than just the size of the market.
You can explore all of TeleGeography’s WAN content over here.
And there's plenty more intel to be found in our Data Center Research Service and WAN Geography Benchmark tools.


Jon Hjembo
Senior Research Manager Jonathan Hjembo joined TeleGeography in 2009 and heads the company’s data center research, tracking capacity development and pricing trends in key global markets. He also specializes in research on international transport and internet infrastructure development, with a particular focus on Eastern Europe, and he maintains the dataset for TeleGeography’s website, internetexchangemap.com.