
Our 2018 Global Internet Map is hot off the press.
This technicolor edition tracks global capacity, traffic, and pricing data, as well as global user figures and the most-connected ISPs. Keep scrolling to see for yourself.
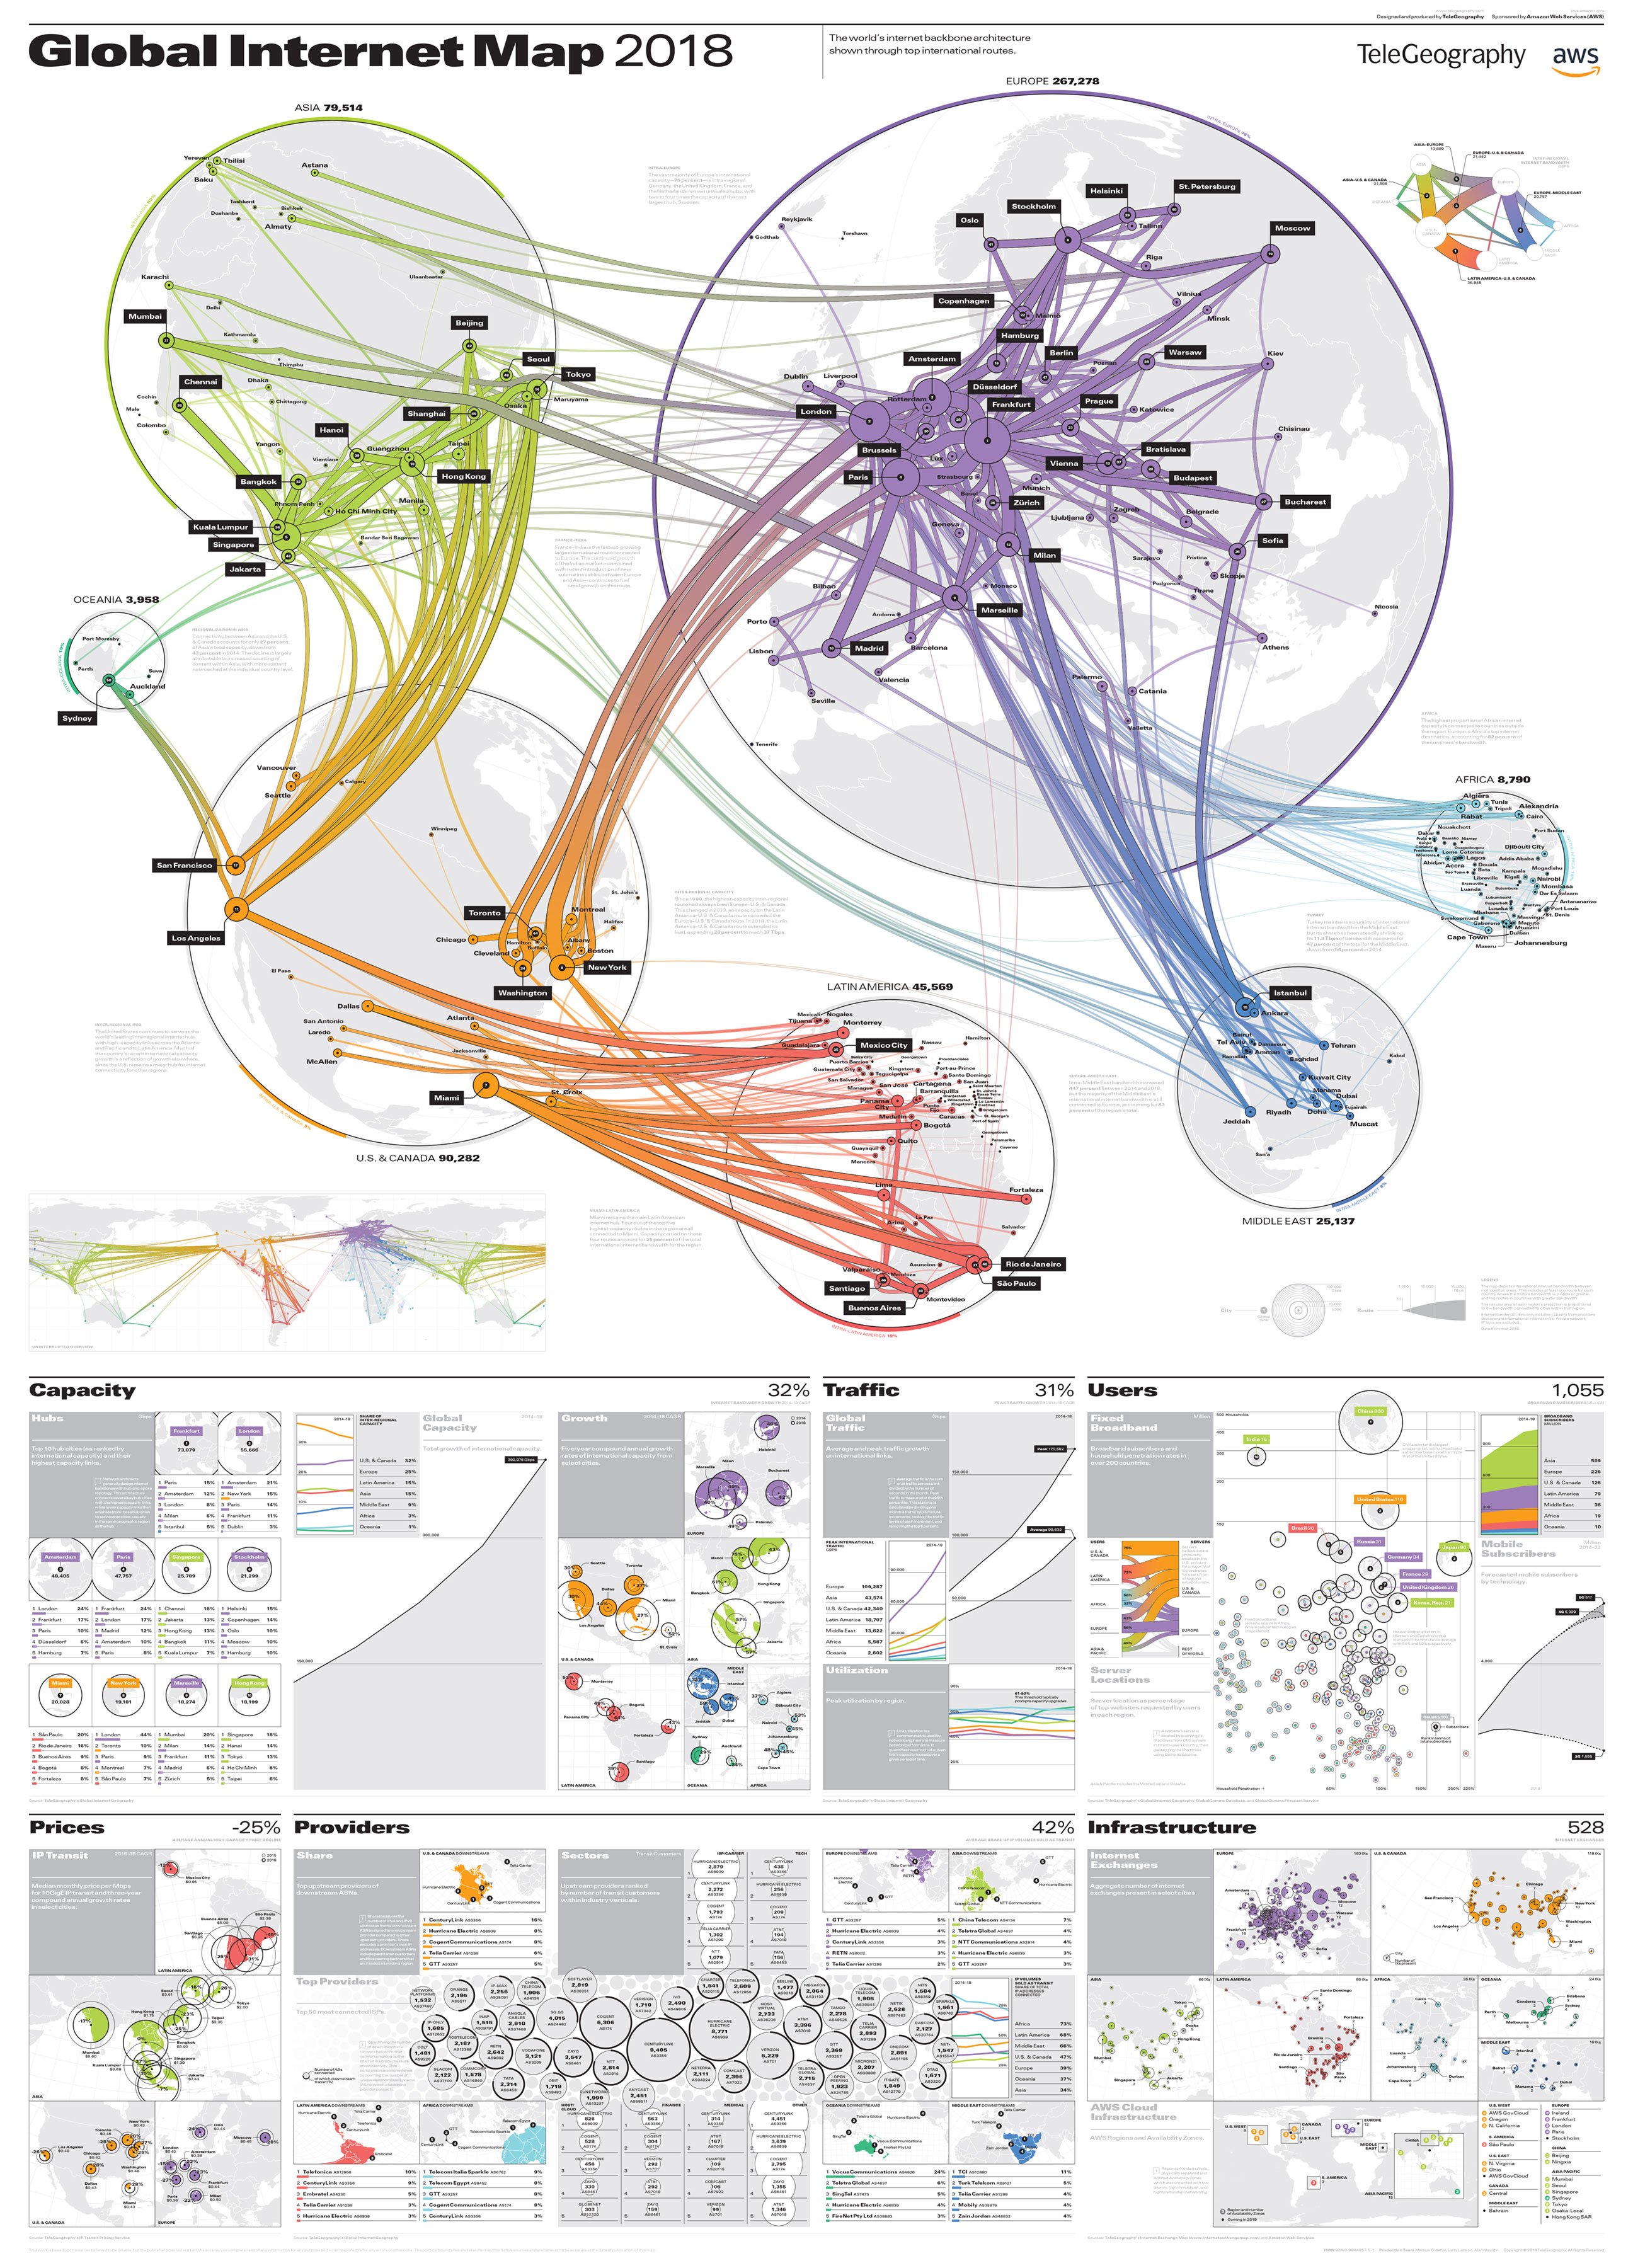
The 2018 map includes:
Main Projection
- Intra- and inter-regional internet bandwidth
- Metro-to-metro area internet bandwidth
- Metro area internet bandwidth
- Top 50 metro areas ranked
Capacity
- Hubs: Top 10 hub cities (as ranked by international capacity) and their highest capacity links.
- Global Capacity: Total growth of international capacity.
- Growth: Five-year compound annual growth rates of international capacity from select cities.
Traffic
- Global Traffic: Average and peak traffic growth on international links.
- Utilization: Peak utilization by region.
Users
- Fixed Broadband: Broadband subscribers and household penetration rates in over 200 countries.
- Server Locations: Server location as percentage of top websites requested by users in each region.
- Mobile Subscribers: Forecasted mobile subscribers by technology.
Prices
- IP Transit: Median monthly price per Mbps for 10GigE IP transit and three-year compound annual growth rates in select cities.
Providers
- Top Providers: Top 50 most connected ISPs.
- Share: Top upstream providers of downstream ASNs.
- Sectors: Upstream providers ranked by number of transit customers within industry verticals.
Infrastructure
- Internet Exchanges: Aggregate number of internet exchanges present in select cities.
- AWS Cloud Infrastructure: AWS Regions and Availability Zones.
Special thanks to our sponsor Amazon Web Services for making this map possible.
 |
Elsewhere on the Blog
1
2
3
4