There's so much information packed into our 2021 Global Internet Map that you might not know where to start.
You could begin by digging into the 35% growth we saw in international internet capacity—from around 450 Tbps to over 600 Tbps—between 2019 and 2020.
Or you could scope out regional connectivity intel, noting that Europe is the region with the highest regional capacity; it also saw the largest growth from 2019 to 2020.
Other notable findings include:
- Global Peak Traffic – Peak international internet traffic increased at a compound annual rate of 30% between 2016 and 2020.
- Global Average Traffic – Average international internet traffic increased from around 120 Tbps to 170 Tbps from 2019 to 2020.
- COVID-19 Impact – The peak traffic growth rate for 2019 to 2020 was forecasted at 28%, however the observed level for the same period was much higher, at 47%.
"It’s been very interesting to track global trends in terms of capacity and traffic over the past year, and learning how operators responded to the pandemic. Our latest data show that global capacity and internet traffic surged in 2020, mostly driven by the widespread remote work and learning, with more people relying on the internet than ever before," said Anahí Rebatta, Senior Analyst at TeleGeography.
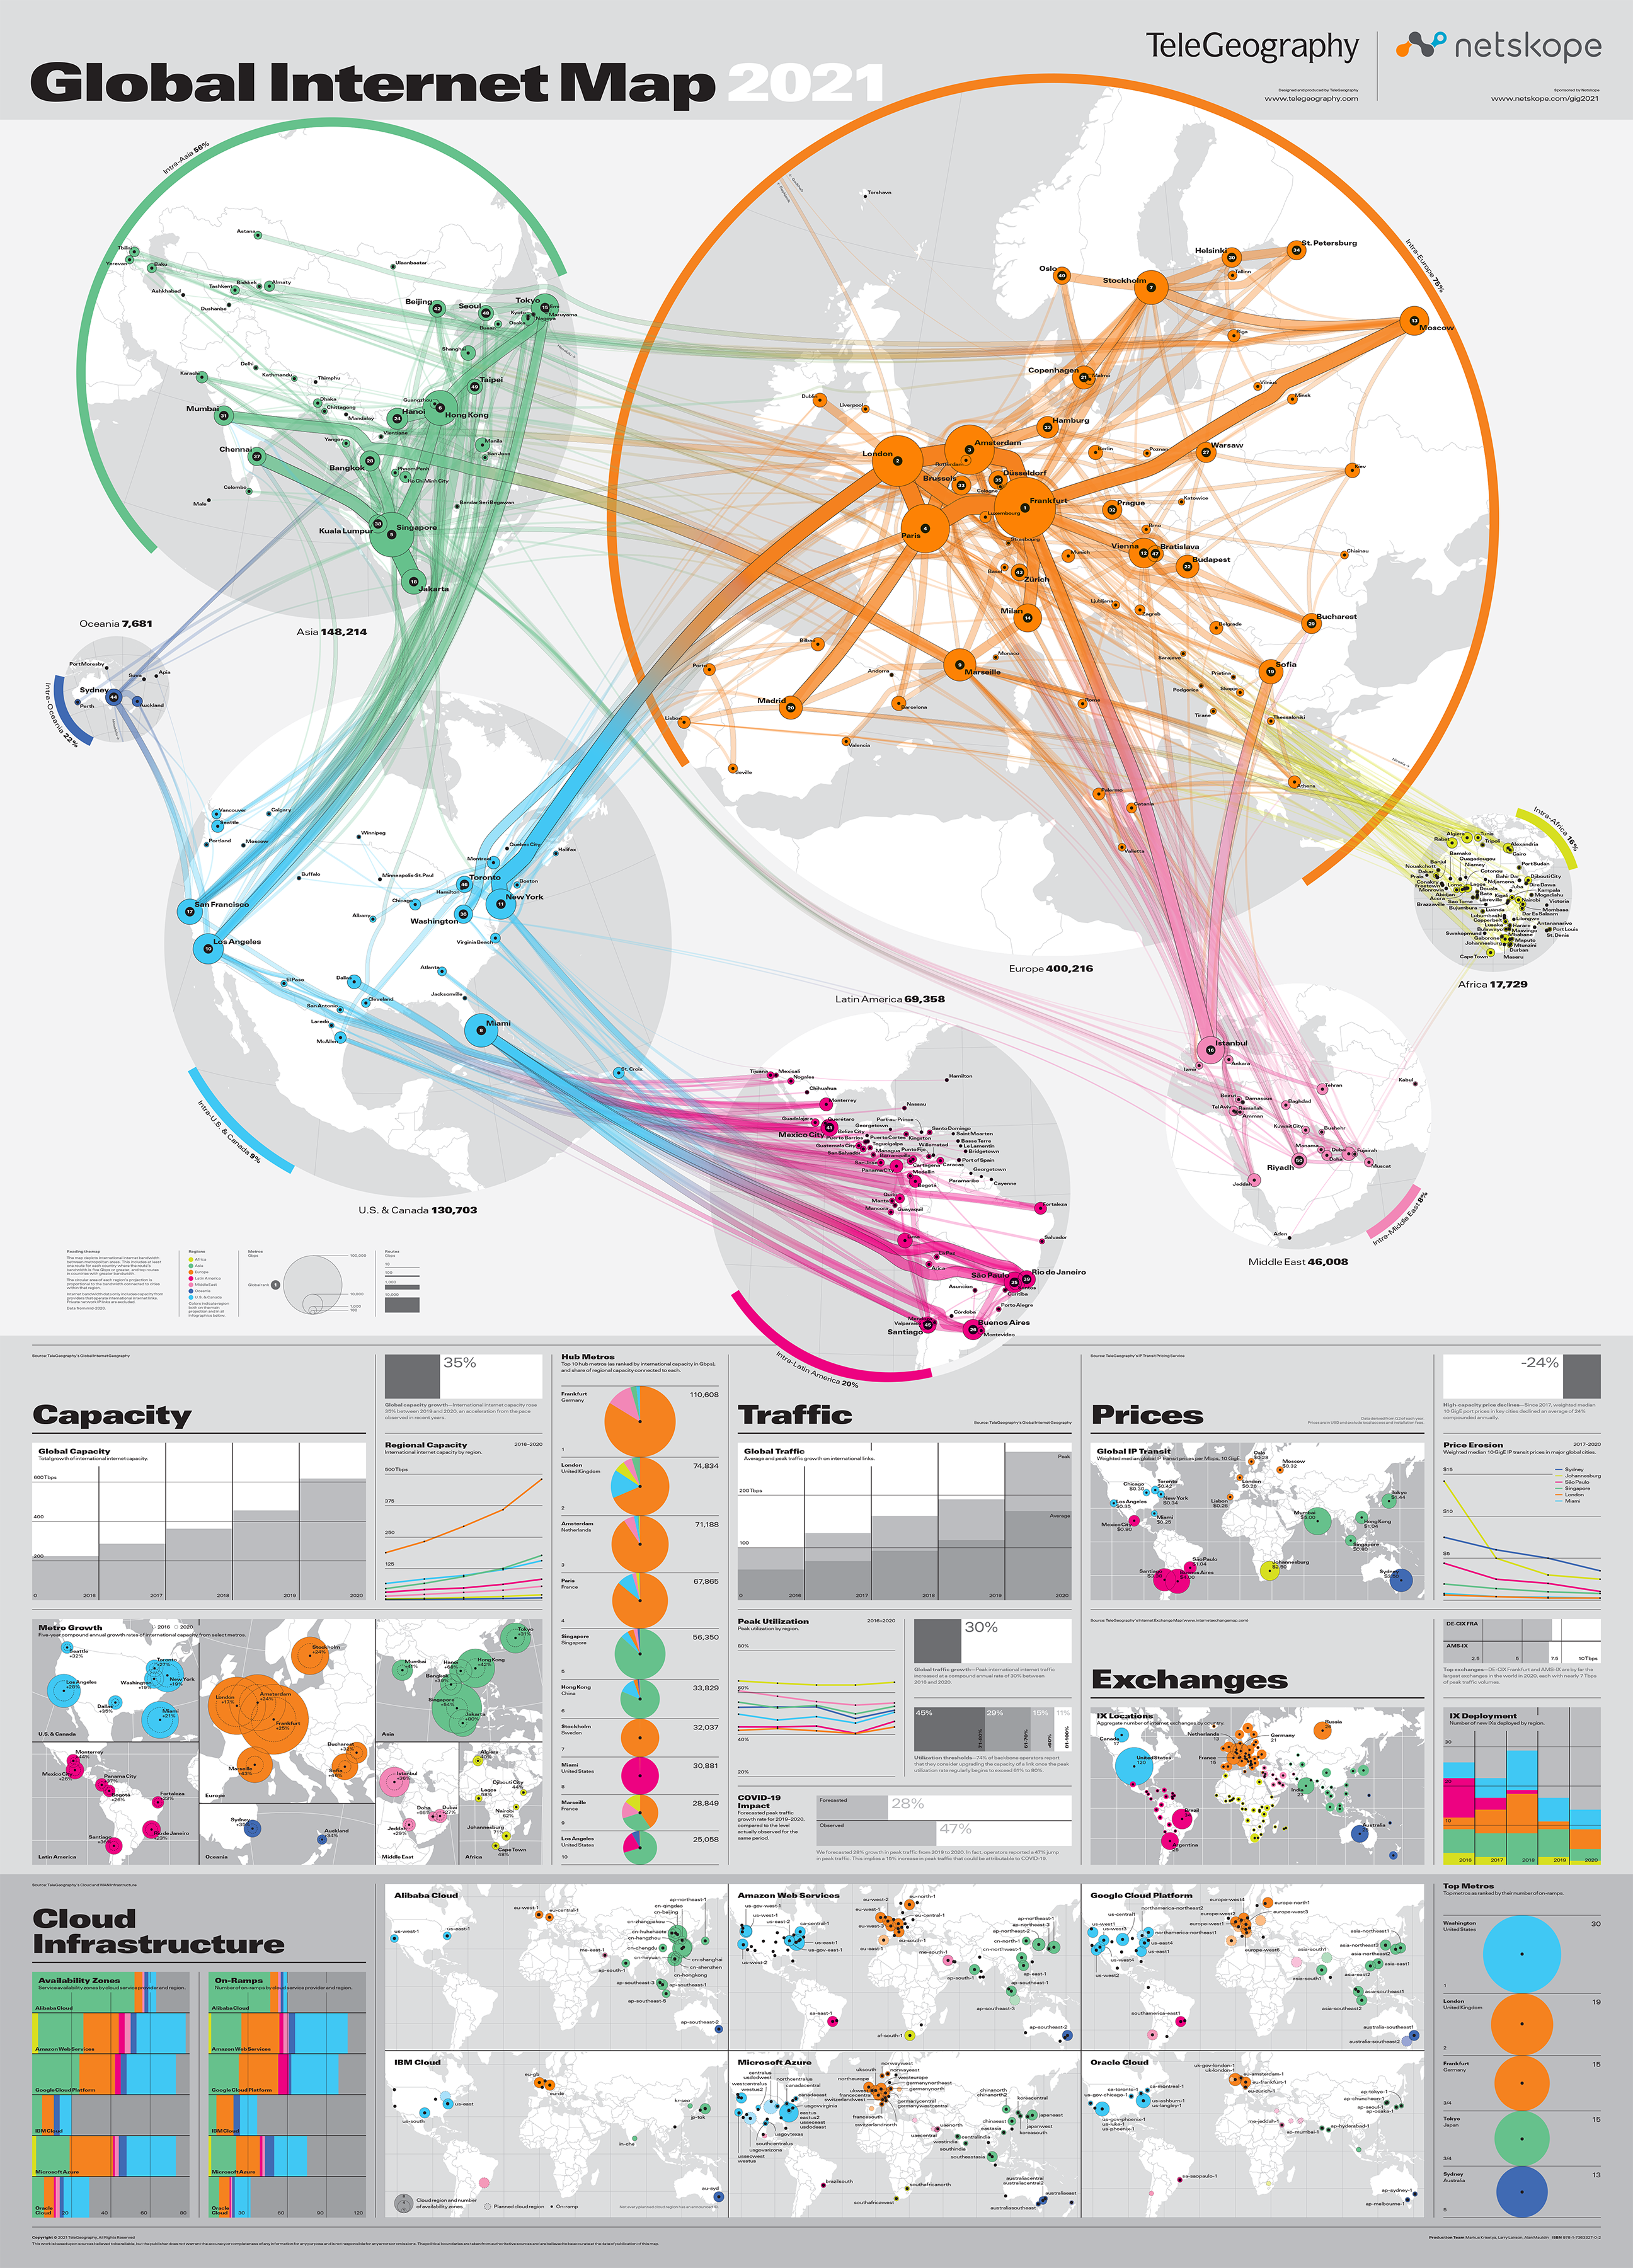
Fans of this map will notice the exciting addition of cloud infrastructure data.
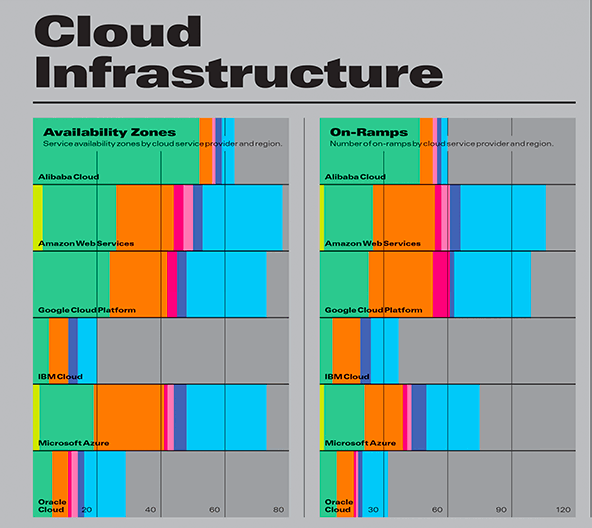
This includes six new cloud service provider maps showing active and planned cloud regions, number of availability zones, and on-ramps.
Per usual, this map also displays key insights into the world’s internet exchanges. These include the aggregate number of exchanges in each country and the number deployed by region over the past five years.
Key projections include intraregional internet bandwidth, metro-to-metro area internet bandwidth, metro area internet bandwidth and the top 50 metro areas ranked.
Our colorful 2021 edition is sponsored by the team at Netskope.
"Netskope is proud to support TeleGeography's 2021 Global Internet Map. We believe a secure and safe internet supports long-term growth and innovation. The disruptions the world saw in 2020 showed the mission-critical nature of the internet and the value it delivers to both businesses and people,” said Joe DePalo, SVP of Platform Engineering at Netskope. “Visibility and insights are vital components of any digital transformation journey, and through the sponsorship of this map we aim to help more businesses respond to global trends and secure their networks.”
Netskope is a leading cloud security provider. It offers visibility and real-time data and threat protection when accessing cloud services, websites, and private apps from anywhere, on any device. With millions of users today—including 25+ of the Fortune 100—Netskope helps the largest enterprises in the world secure their journey to the cloud, as well as working closely with global service providers to deliver Netskope-powered managed services.
The map is available as both an online interactive version or a physical version to hang on the wall or take to meetings.