Many retail service providers, such as mobile operators, MVNOs, and cable broadband providers, rely heavily on wholesale carriers to transport and terminate their customers’ international calls.
Our recently updated TeleGeography Report and Database provides new voice traffic data and analysis—including trends in wholesale prices and revenues.
I think you know where we're going with this.
Let's talk data.
Wholesale carriers terminated approximately 285 billion minutes of traffic in 2020, down 7% from 2019.
Even though wholesale traffic declined in 2020, over the last ten years wholesale traffic grew at a compounded annual rate of 1% while overall traffic dropped by 2% per annum. Wholesale carriers terminated more than two-thirds (70%) of international traffic in 2020.
Traffic to mobile phones in emerging markets has spurred expansion of the wholesale market, and that demand continues to drive wholesale’s growth.
Traffic to mobile phones in emerging markets has spurred expansion of the wholesale market, and that demand continues to drive wholesale’s growth.
In 2020, wholesale carriers terminated over 85% of traffic to Sub-Saharan Africa and South America. In contrast, wholesale carriers terminated only 54% of traffic to western Europe.
Wholesale revenues have changed only marginally from ten years ago. Wholesale ILD generated $16.1 billion in 2019 and $14.5 billion in 2020.
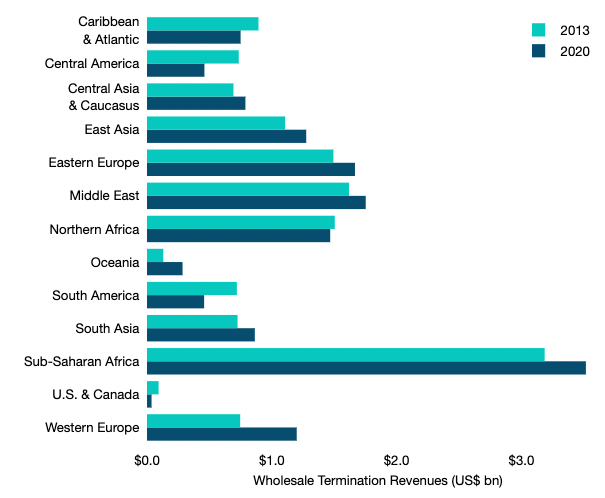
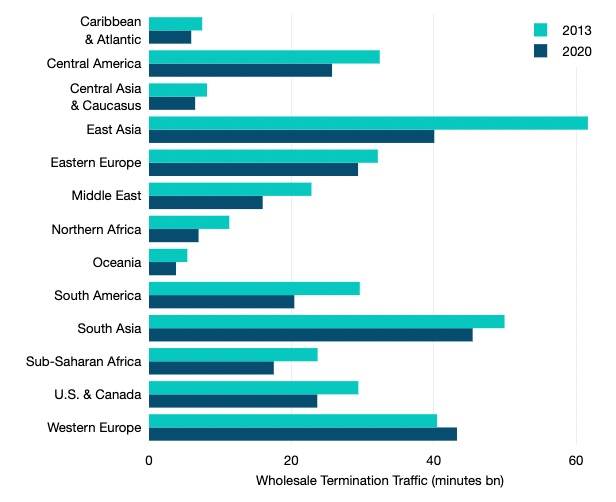
But let’s take a moment to look under the hood. The geographic sources of this revenue have changed substantially (see the figures below).
Total Wholesale Revenues, 2013 vs. 2020

Total Wholesale Traffic, 2013 vs. 2020

Revenues on calls to Europe grew 61% between 2013 and 2020. That's largely due to traffic growth to European mobile phones.
The U.S. & Canada regions provide a mirror image. Revenues on calls to U.S. & Canada fell by 61%.
Over the past decade, traffic to mobile phones in emerging markets has driven international wholesale market growth.
Revenues from calls to mobiles in emerging markets noticeably increased from $8.1 billion in 2010 to $11.3 billion in 2020. As a portion of overall wholesale carrier revenues, calls to advanced economies shrank, as did revenues from calls to fixed lines in emerging markets.
Wholesale revenues are bolstered by a select set of low-traffic routes with stubbornly high prices.
Wholesale revenues are bolstered by a select set of low-traffic routes with stubbornly high prices. For example, the France to Tunisia route accounts for just 0.3% of international traffic, but, at $0.51 per minute, it provides 3.6% of all revenues.
Thanks to low termination prices in Mexico, the U.S.-Mexico route serves as a converse example: that massive route represents 7% of all international traffic in the world, but only 0.2% of wholesale carrier revenues.
Who's carrying all this traffic?
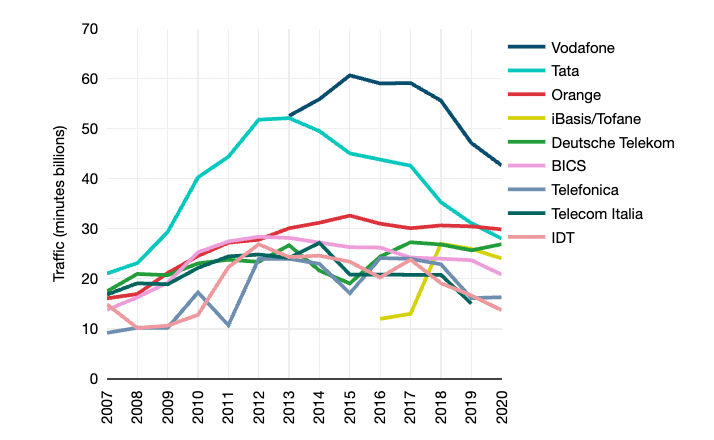
Take a look at the figure “Comparison of Top International Carriers,” which shows a ranking of some of the world’s largest international carriers.
The top 10 operators in the figure carried over half of all global traffic in 2020, about 220 billion minutes. Among the eight largest carriers in the world, only one terminated more traffic in 2020 than in 2019, and just barely.
Traffic Volumes of Major Carriers

You can download a full copy of this executive summary over here.
Patrick Christian
Patrick Christian is a Senior Research Manager with TeleGeography. He heads the Cloud and WAN Research Service. He also focuses on African and European markets specializing in international bandwidth markets and internet infrastructure, WAN services, terrestrial and submarine cable systems, and international voice traffic analysis.

