


In a recent analysis, we highlighted how DIA has gained ground as an integral part of the global enterprise WAN and how it compares in price directly to MPLS.
However, it is not just a matter of switching underlay products, but also understanding the global pricing dynamics of those alternatives.
Many of our WAN Cost Benchmark customers model the cost savings of lowering their MPLS exposure, but it can be equally important to understand the impact of geography on DIA sourcing decisions.
WAN managers signing three to five year contracts for legacy MPLS networks certainly needed to grasp how prices varied across their global locations.
In the DIA-driven network, especially where one might purchase DIA from a smaller carrier on a shorter term, staying on top of global pricing trends becomes more complex than “has my carrier dropped prices enough by renewal time?”
Internet price differences globally might impact product choice, carrier choice, and contractual arrangements in ways that weren’t applicable for MPLS networks.
Internet price differences globally might impact product choice, carrier choice, and contractual arrangements in ways that weren’t applicable for MPLS networks.
Global Pricing Trends
DIA prices vary considerably across geographies. While prices historically always go down, the pace of price erosion also varies by market.
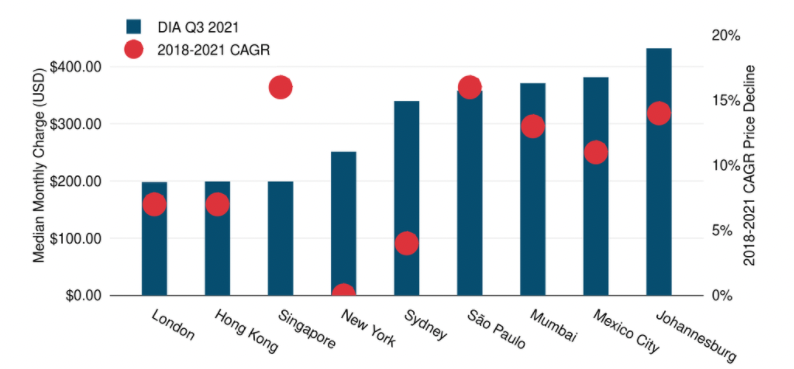
To illustrate this, we looked at Q3 2021 DIA prices for 10 Mbps and 100 Mbps in nine markets around the world. We also included the CAGR price decline to highlight how prices have changed across these markets over the past three years.
On average, 10 Mbps prices across the key cities below decreased by 10% and by 19% for 100 Mbps, compounded annually since 2018.
As the higher capacity increment falls at a faster rate, this demonstrates that economies of scale at the transport layer are being passed through.
Median 10 Mbps DIA Prices and 3-Year CAGRs in Key Global Cities
In Canada, where median price points are lower than in the U.S., the situation is similar. Median prices for both Toronto and Vancouver were reported to be $982 per month.
Part of the reason Canadian cities have lower pricing than the U.S. is that fewer international providers—who have to account for the cost of global networks—are present there. Instead, the market largely consists of fewer, more competitively priced, regional providers.
However, price erosion over the past three years has been steeper in the Canadian market.
Median GigE prices in Toronto and Vancouver fell 18% from 2018-2021. That’s much faster than in key U.S. cities where three-year declines were 4% or slower.
In New York, this decline was even more stark, with prices falling roughly 0% from 2018-2021. But it is important to note that while the median price point has remained stable, across carriers that have contributed pricing for New York, individual price reductions ranged from 0% to 26%, compounded annually from 2018.
Latin America
Unlike in North America, markets in Latin America have a wide range of pricing available for GigE DIA ports. Further, price reduction rates in the region are also more varied.
Median GigE DIA Port Prices and CAGR Price Declines in Key Latin American Cities
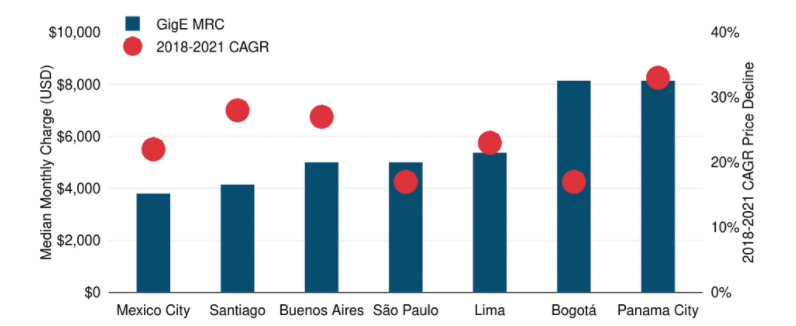
Within Latin America, carriers have mixed approaches for pricing. Some offer flat pricing for all markets throughout the region, while others determine prices by country.
In Bogotá and Panama City, the Q3 2021 median price for a GigE port is $8,139. That’s more than double the price of a comparable DIA port in Mexico City of $3,799. Some of this is a result of more limited competition in those markets. But regulatory environments and overall demand are also important factors.
In terms of price erosion, carriers with global networks reported declines in their DIA pricing in Panama City over the past three years by 33%, compounded annually. A more established market like São Paulo has had comparably slower erosion at 17% since 2018.
As price discounts over MPLS and compatibility with SD-WAN technology incentivize more companies to adopt DIA, we expect prices to continue falling faster in growing markets.
As price discounts over MPLS and compatibility with SD-WAN technology incentivize more companies to adopt DIA, we expect prices to continue falling faster in growing markets.

Greg Bryan
Greg is Senior Manager, Enterprise Research at TeleGeography. He's spent the last decade and a half at TeleGeography developing many of our pricing products and reports about enterprise networks. He is a frequent speaker at conferences about corporate wide area networks and enterprise telecom services. He also hosts our podcast, TeleGeography Explains the Internet.