
As network requirements balloon, global IP transit prices continue to decline. Even in the face of a global pandemic.
But the pace of price erosion over the past three years and the factors driving it vary throughout the world. Declines have been greatest in emerging markets, where prices are highest. Increases in volume, local traffic exchange, and number of suppliers can improve economy of scale, underlying transport cost, and competition, respectively. In established global hubs, prices continue to fall at a significant pace, largely a result of escalating volume and declining unit cost.
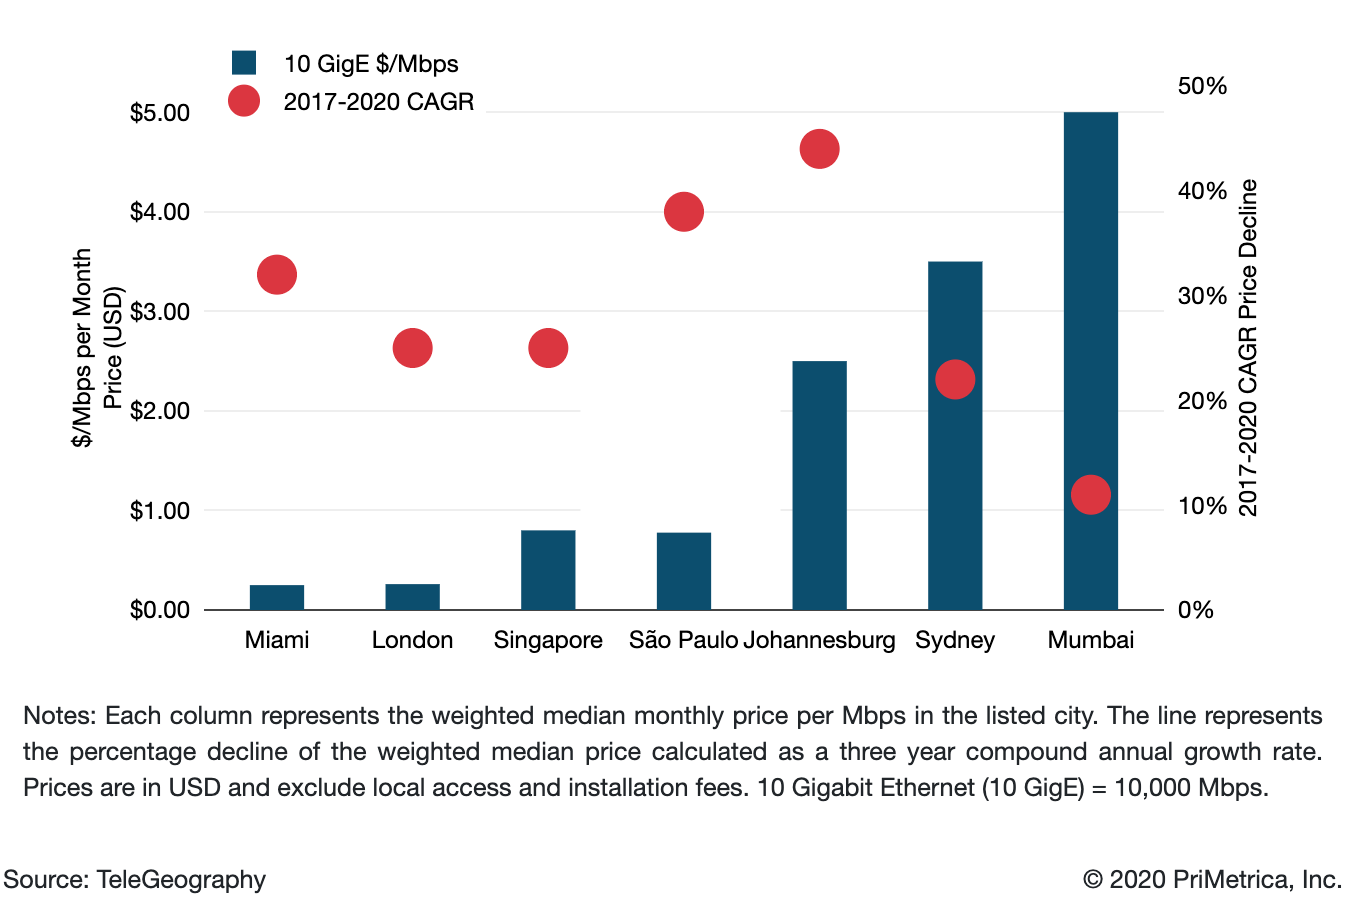
Price Declines in the Shadow of a Pandemic
Weighted Median 10 GigE IP Transit Prices & Three Year CAGR Decline in Major Global Cities
Let's look at a few snapshots from around the world.
Price erosion in global hubs such as London and Miami continues at a steady clip—25% and 32%, respectively, since 2017. Both cities house some of the most robust markets and lowest prices for IP transit. Not only due to regional traffic exchange. They also draw intercontinental traffic from Africa, the Middle East, and Latin America, where remote traffic exchange is more cost-effective than buying transit locally.
This further fuels the high-volume market dynamics in the global hubs.
Similarly, Singapore has cemented itself as a hub for intra-regional traffic exchange in Asia. Accordingly, it hosts the most competitive prices in the region. But even with a 25% rate of price erosion since 2017, IP transit in Singapore remains more expensive than western Europe and the United States.
Since 2017, the price of a 10 GigE port in Singapore has hovered at about three times the price in London, a reflection of differences in market participants, underlying costs, as well as continued robust price declines in the British capital.
The price for a 10 GigE port in Johannesburg dropped 44% over the past three years. This largely reflects falling transport prices linking South Africa to Europe. But also, Johannesburg’s position as a regional market leader in terms of carrier neutral data centers, localized content, the presence of cloud service providers, and carrier competition.
Similarly, a majority of international traffic connecting Latin America and Oceania is intercontinental, transiting undersea cables to the U.S. to exchange traffic and access content (often more cost effectively than locally). But both regions have seen upgrades to existing systems and the launch of new regional submarine cables linking them to global internet hubs in the U.S. This has greatly bolstered supply and competition, lowering underlying transport costs. As a result, prices for 10 GigE ports in São Paulo and Sydney fell 38% and 22% compounded annually over the past three years. Weighted median prices in the two cities are $1.04 and $3.50 per Mbps.
In the transit market, 100 GigE ports are starting to gain traction where 100 Gbps transport is already well entrenched. Some carriers are considering 400 GigE ports, while others are already looking forward to another 10x upgrade to 1 Tbps ports.
While price multiples between 10 GigE and 100 GigE ports have declined, for many customers the motivation to upgrade to a larger port is not purely financial. Ease of management and future proofing the network have become particularly important in light of recent events.
While price multiples between 10 GigE and 100 GigE ports have declined, for many customers the motivation to upgrade to a larger port is not purely financial. Ease of management and future proofing the network have become particularly important in light of recent events.
With the shift to higher capacity ports and increasing localization of traffic exchange and content hosting, continued price erosion is a safe bet for the foreseeable future.


Kate Reilly
Kate Reilly is a Senior Analyst at TeleGeography. As part of the pricing team, Kate contributes analysis to both enterprise and wholesale products.