Technology such as SD-WAN, migration to the cloud, and the sudden surge of remote and distributed work have upended the modern WAN.
The composition of the underlay, flow of traffic, end points of workers, and security postures are all undergoing a massive shift. Like the protagonist in Canadian power trio Rush’s hit “Tom Sawyer,” WAN managers are realizing that “changes aren’t permanent, but change is.”
Since 2018, we've tracked how these changes appear in actual enterprise network choices through our annual WAN Manager Survey. And the latest results are hot off the press.
Today I want to focus on network configuration trends.
SD-WAN frees WAN managers to select a broad mix of underlay technologies. Enterprises also increasingly opt for local rather than centralized internet breakouts whether or not they have adopted SD-WAN. Because of these changes, many in the industry have been wondering how much longer MPLS will be the dominant product in the WAN.
SD-WAN frees WAN managers to select a broad mix of underlay technologies. Enterprises also increasingly opt for local rather than centralized internet breakouts whether or not they have adopted SD-WAN. Because of these changes, many in the industry have been wondering how much longer MPLS will be the dominant product in the WAN.
To keep track of how enterprises might shift their connectivity, we've asked about WAN configurations since 2018. Our survey included several questions about the size, geography, and sourcing of multinational corporate networks.
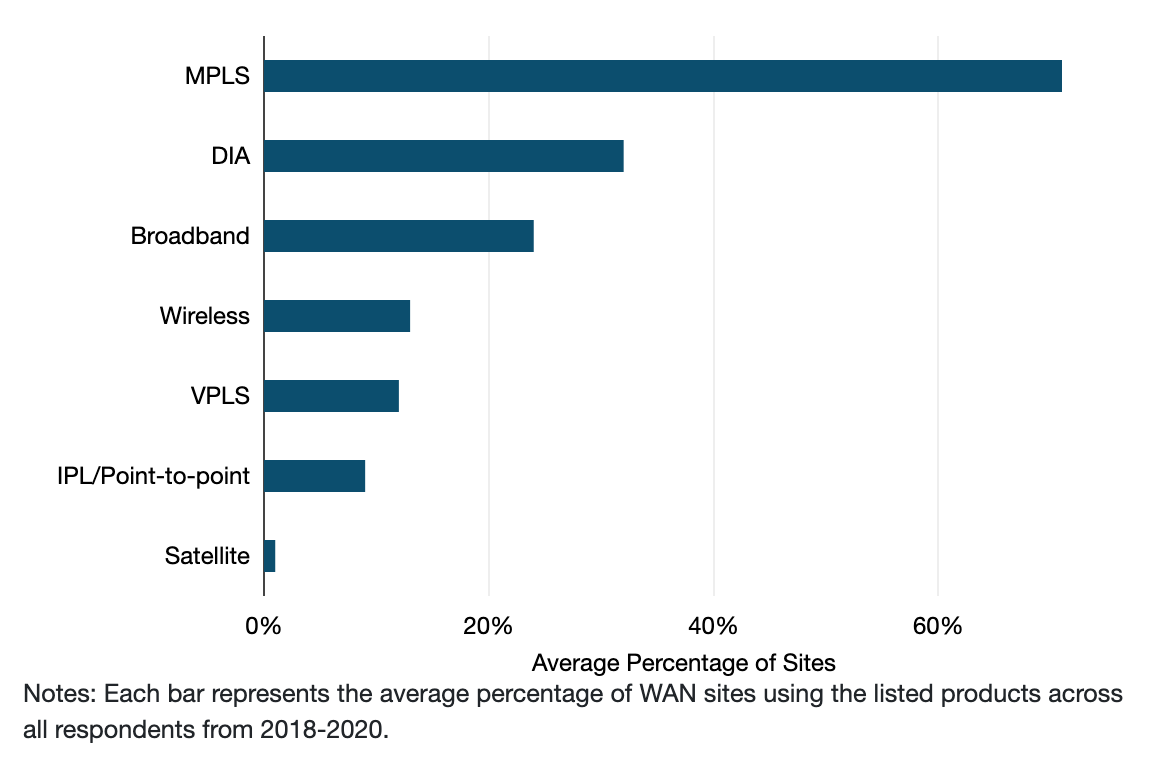
While there are undeniably forces at work that are likely to diminish MPLS use going forward, it was still the most prominent network product deployed on global enterprise WANs in these survey years. The average respondent’s WAN was running MPLS at 71% of sites (averaged across 2018-2020), which easily eclipsed other underlay products.
This is how the some of the other products were distributed:
MPLS Maintains the Throne—For Now
What is the average product mix of your WAN sites? (2018-20)

- Internet services are likely growing today, but were far from ubiquitous in respondent networks. The average network was running DIA at about one-third of sites and broadband at about one-quarter of sites.
- Wireless and satellite represented a very small percentage of WAN sites and were often only used as backups, temporary connectivity, or when no wireline service is available. It is notable, however, that about 5% of respondents had wireless at all or nearly all sites.
While some individual carrier MPLS and DIA pricing plans have converged, by and large we still see a fairly significant price spread between MPLS and DIA at a market level.
There is undeniably a massive price spread between MPLS and broadband. So, it's not surprising to see MPLS port sizes skew lower than internet circuit sizes.
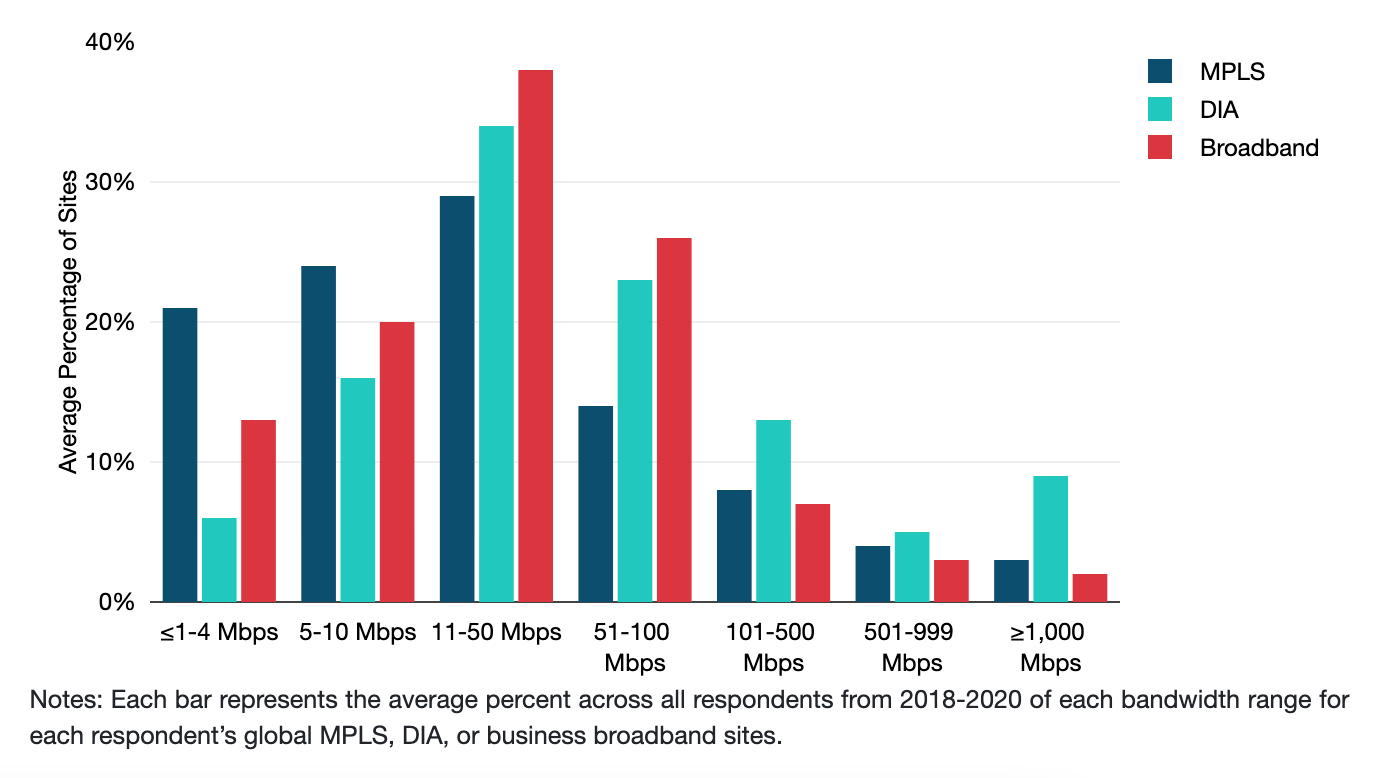
Most MPLS Sites 50 Mbps or Below
What percentage of your global ports fall within each port size/bandwidth range? (2018-20)

- MPLS port sizes skewed toward the lower capacities. Three-quarters of MPLS sites were 50 Mbps or below.
- DIA was the most commonly used product at the higher end of the ranges in our survey, with about one-quarter of sites above 100 Mbps.
- While larger sites from >FastE to ≥GigE are fairly uncommon, they were most likely to be DIA. Nearly one in ten DIA sites were GigE or above.
Download the latest executive summary of our popular WAN Manager Survey here.
Greg Bryan
Greg is Senior Manager, Enterprise Research at TeleGeography. He's spent the last decade and a half at TeleGeography developing many of our pricing products and reports about enterprise networks. He is a frequent speaker at conferences about corporate wide area networks and enterprise telecom services. He also hosts our podcast, TeleGeography Explains the Internet.


