TeleGeography started producing submarine cable maps in 1999, but we had been mapping the world of telecommunications for years before that.
Our first map was completed in 1996. This effort depicted several in-service cables. It also shows FLAG as a proposed cable, which is pretty neat.
If you can believe it, by 2018, all of the active cables we mapped in 1996 had been retired.
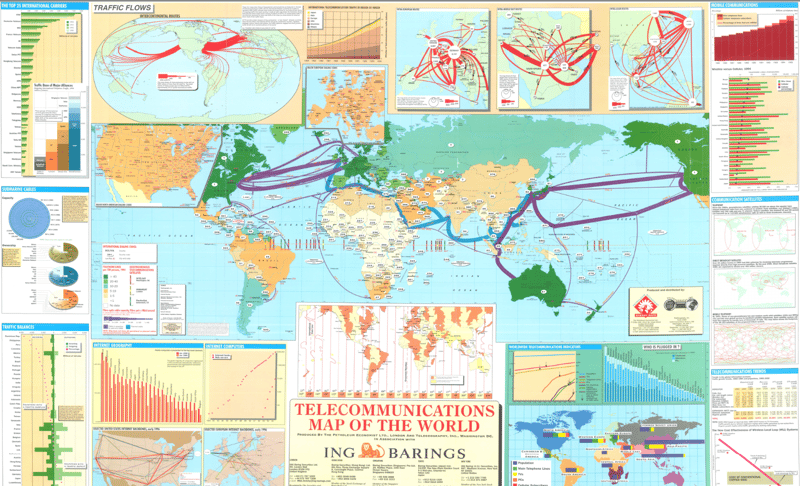
Speaking of throwbacks, our first few maps feature lots of information about voice traffic, including flow infographics and country dialing codes.
Voice accounted for the majority of submarine cable traffic at the time—it’s now around 0.1%—and cables were planned around carriers’ projected call traffic requirements. (That sounds like a similar story that we recently shared on our blog.)
Cable capacity was even listed as number of voice channels, not bits per second.
Our second map, published in 1997, hints at the explosion of new fiber optic cables to come. Several planned systems are shown on the map; some of those cables—like Gemini and China-U.S.—that were planned/under construction at the time have now been retired.
The 2025 Cable Map

We've come a long way since 1996.
This futuristic, high-contrast 2025 design depicts 597 cable systems and 1,712 landings. For those keeping score, that's 38 more cable systems and 76 more landings than the 2024 edition.
At the bottom of this map, we zero in on Networks of the Future with potential capacity, used capacity, and cable deployment stats for six major submarine cable routes: Trans-Pacific, U.S.–Latin America, Trans-Atlantic, Europe–Sub-Saharan Africa, Europe–Asia via Egypt, and Intra-Asia.