


Network underlays have been in transition as more enterprises install SD-WAN services and attempt to meet the increase in cloud traffic. Companies are looking to lower costs and increase connectivity while maintaining secure networks.
All of these changes have led to a decrease in MPLS usage, but has the decline in MPLS stalled?
Here are some insights from our newly released 2022 WAN Manager Survey.
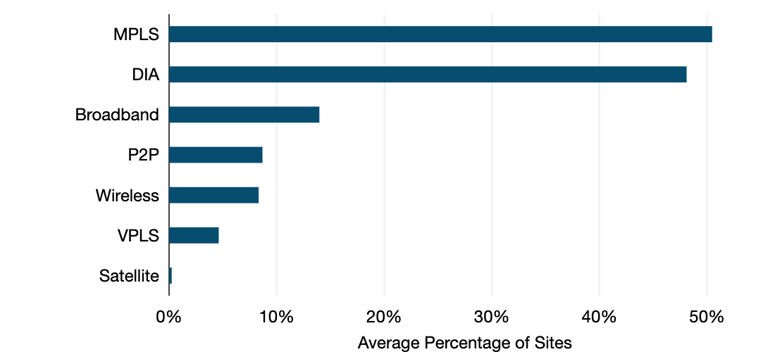
What is the average product mix of your WAN sites? (2022)
-
This is the first year that MPLS usage has seen some stability after the past several years of downward trends. It increased five percentage points from last year, from 46% up to 51%.
-
There is a near convergence of the average number of sites running MPLS and DIA this year, with MPLS at 51% of sites and DIA at 48%.
-
Broadband still appeared in third place behind MPLS and DIA, but dropped nine percentage points since 2021. The service is now only present at 14% of sites.
-
Point-to-point/International Private Line (P2P/IPL) was present in 9% of sites, mostly for connections between data centers and disaster recovery sites.
Wireless, while more popular than satellite, was a relatively unpopular choice for WAN connectivity still in 2022. Of course, some of our survey respondents had considerably more sites on wireless, but on average it was only used at 8% of sites.
One respondent we interviewed from a company with thousands of small points of sale (often well outside major metros) had transitioned many such locations to LTE-enabled tablets, moving away from basic broadband. As they said: “Cellular on a mediocre day is better than DSL.”
As 5G internet access plans become more available, especially with broadband-like usage terms, we expect to see wireless usage rise in the coming years.
As 5G internet access plans become more available, especially with broadband-like usage terms, we expect to see wireless usage rise in the coming years.
Network Services Time Series
To examine product trends over time, we compared the change in percentage points between 2022 and previous years.
Individual network configurations do not change rapidly due to contract length and the time it takes to go from RFI/RFP to installed network, but our time series clearly indicates that WAN configurations are undergoing a shift.
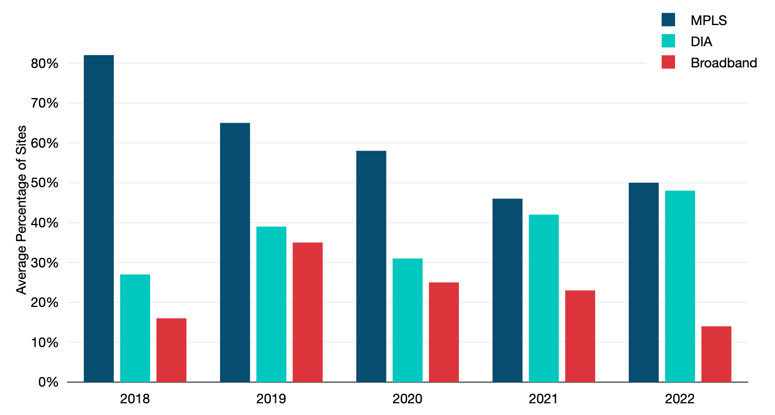
What is the average product mix of your WAN sites? (2018-22)
-
There is a clear downward trend in MPLS usage, as the product decreased by 32 percentage points since 2018.
-
DIA usage mirrored this trend in reverse, as it increased from 27% in 2018 to 48% in 2022.
-
Broadband trends have fluctuated from a rapid 19-point increase between 2018 and 2019 to fall back to 14% by 2022.
Bandwidth Distribution by Product
Especially post-pandemic, offices have been under constant bandwidth pressure.
With the evolution of SD-WAN, WAN managers have begun to shrink port sizes for MPLS while increasing DIA and business broadband bandwidths. Altering these port sizes often lowers the total cost of ownership, making it a compelling data point to measure.
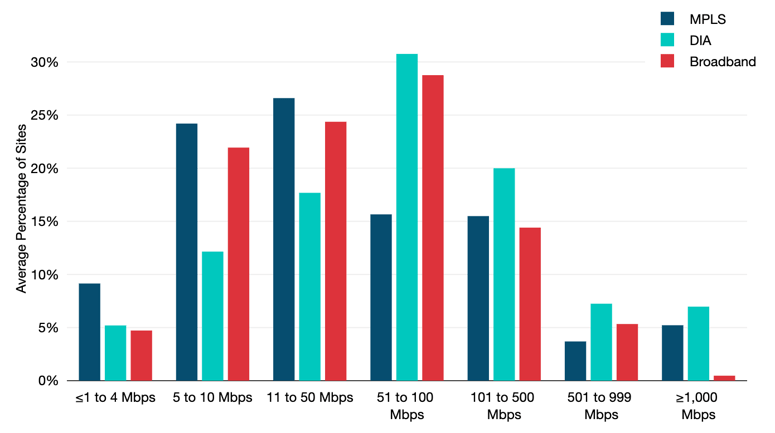
What percentage of your global ports fall within each port size/bandwidth range? (2022)
-
In 2022, MPLS usage peaked at 11-50 Mbps with 27% of sites.
-
DIA was a more common product in the top four bandwidth ranges, peaking at 31% for the 51-100 Mbps range.
-
Business broadband also peaked at 29% in the 51-100 Mbps range before steeply dropping to 14% in the following range.
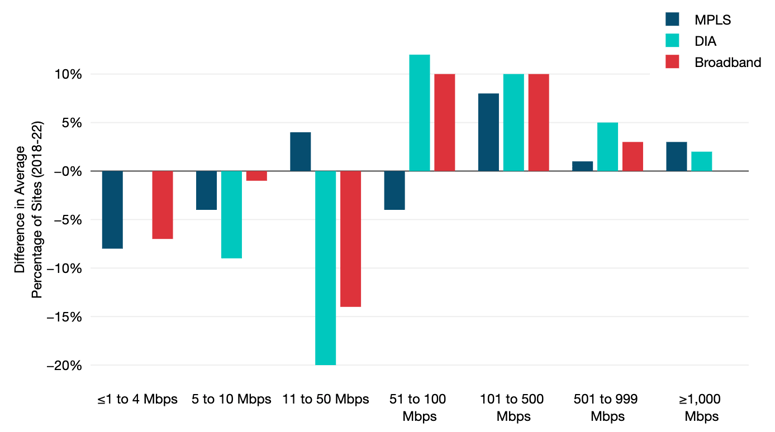
Difference in Percentage of Sites (2018-2022)
-
Since 2018, all MPLS port sizes of 50 Mbps and below have shrunk, most notably seven percentage points at the ≤1-4 Mbps range.
-
DIA saw increases in all port sizes above 50 Mbps, with the largest increase of 12 points in the 51-100 Mbps range.
-
Another major shift at the 51-100 Mbps range: business broadband increased 10 points over the past four years.
This analysis was pulled from our latest WAN Manager Survey—which now includes data collected throughout 2022.
Download the full executive summary to keep reading.


Greg Bryan
Greg is Senior Manager, Enterprise Research at TeleGeography. He's spent the last decade and a half at TeleGeography developing many of our pricing products and reports about enterprise networks. He is a frequent speaker at conferences about corporate wide area networks and enterprise telecom services. He also hosts our podcast, TeleGeography Explains the Internet.