


We've written before about how prices vary by geography. It almost goes without saying that they also change over time.
Over the last 15 years of price tracking, we've consistently observed annual declines of around 10% to 20% over the long term. We can see slower or more rapid declines in some locations or bandwidths, but prices always go down over longer terms.
Over the last 15 years of price tracking, we've consistently observed annual declines of around 10% to 20% over the long term. We can see slower or more rapid declines in some locations or bandwidths—but prices always go down over longer terms.
Most WAN contracts are multi-year (usually three to five years for MPLS networks) so enterprise IT infrastructure teams have long needed to understand how dynamic WAN pricing can be. And how to best negotiate.
However, in the changing WAN landscape, it's become even more crucial to understand how the relationship between product pricing is changing as well.
As trends can vary depending on many circumstances within a single year (often sampling or consolidation issues), we tend to look at both the annual decline and the three-year compound annual growth rate.
Let's go to the charts.
The following set of graphics illustrates price changes for 10 key global metros for several bandwidths in MPLS ports. (We exclude local access in these declines, as there are different market forces at play in the access market compared to the network market. And in the MPLS charts, we've assumed a best-efforts port, as higher CoS prices are generally tied directly to best efforts rather than following their own trends.)
Year on Year and Three Year CAGR for 20 Mbps Best Efforts MPLS Ports in 10 Key Metros
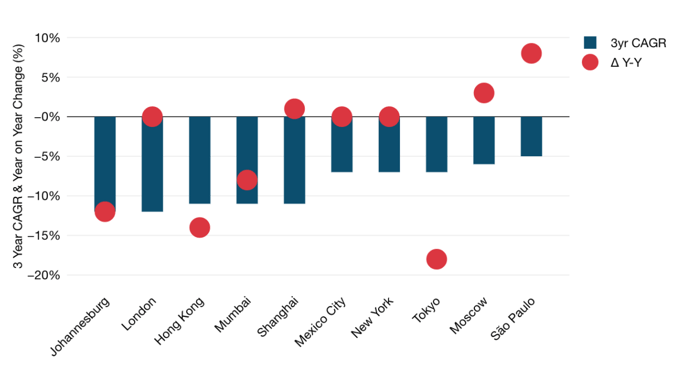
- 20 Mbps is notable for the relatively mild declines, many at only around -5 to -10% for the 3-year CAGR.
- Decline levels do not show clear regional trends. The very different markets of London and Johannesburg are nearly tied for the steepest CAGRs while markets as different as Mexico City and New York City are tied in the middle.
- Some markets posted no change or even a slight increase on an annual basis. While this can happen, the trend over time seen in the 3-year CAGRs always heads toward declines.
Year on Year and Three Year CAGR for 50 Mbps Best Efforts MPLS Ports in 10 Key Metros
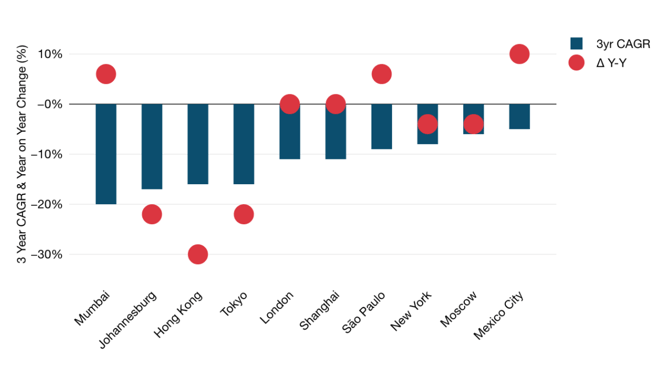
- As with 20 Mbps, annual trends for 50 Mbps can vary considerably from CAGRs, including a few annual median prices that actually went up. Annual price increases are usually due to market consolidation or sampling issues.
- Again, there are not very clear regional trends in comparison to each other, but downward pressure is the rule.

Greg Bryan
Greg is Senior Manager, Enterprise Research at TeleGeography. He's spent the last decade and a half at TeleGeography developing many of our pricing products and reports about enterprise networks. He is a frequent speaker at conferences about corporate wide area networks and enterprise telecom services. He also hosts our podcast, TeleGeography Explains the Internet.