
Not so long ago, tuning out a cacophony of ever-ringing desk phones was just part of the job for many office workers.
These days, that's no longer the norm. And it has nothing to do with the rise of wireless earbuds.
A new-ish market dynamic—social calling that replaced business communications as the primary driver of ILD usage—fueled a long era of international call traffic growth that began in the 1990s.
In 1990, U.S. international call prices averaged over one dollar per minute(!) and business users accounted for 67% of ILD revenue. A wave of market liberalization in the subsequent decade brought new market entrants, causing prices to tumble, and making international calling ever more affordable to consumers.
In the early 2000s, the introduction of low-cost prepaid phones made it possible for billions of people in developing countries to obtain their own telephones, and to keep in touch with friends and family abroad easily. Call volumes soared, and by 2015, calls to mobile phones in developing countries accounted for 65% of global ILD traffic.
The transition to mobile and social calling drove a 20-year boom in voice traffic, but has also left the industry uniquely vulnerable to the rise of mobile social media.
The transition to mobile and social calling drove a 20-year boom in voice traffic, but has also left the industry uniquely vulnerable to the rise of mobile social media.
While Skype was the dominant communications application for computers, a veritable menagerie of smartphone-based communications applications, such as WhatsApp, Facebook Messenger, WeChat (Weixin), Viber, Line, KakaoTalk, and Apple’s FaceTime, now pose a greater threat.
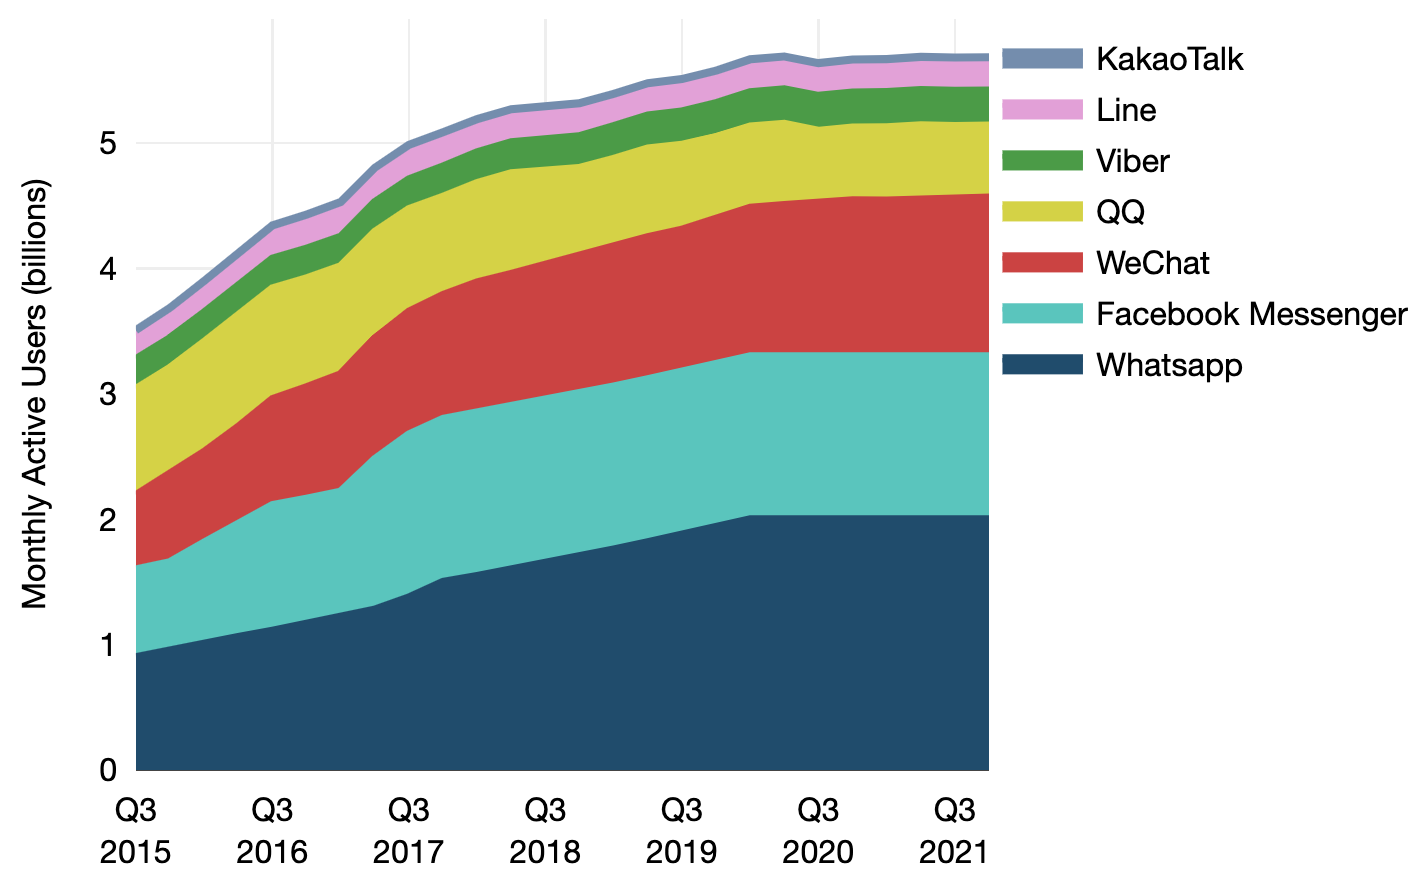
WhatsApp had about 2 billion monthly active users in 2021, with Facebook Messenger topping 1.3 billion. WeChat reported about 1.2 billion active users at the same time.
TeleGeography estimates that seven OTT communications applications—WhatsApp, Facebook Messenger, WeChat, QQ, Viber, Line, and KakaoTalk—combined had nearly 6 billion monthly users in September 2021 (with surprisingly not much growth from 2020).
These estimates exclude apps for which directly comparable data is unavailable, including Apple’s FaceTime, Google Hangouts, and Skype (the latter two of which have over 1 billion downloads from Google’s App Store).
Monthly Active Users of Major Messaging Applications
It's hard to pin precise numbers on the volume of international OTT communications. However, a simple thought experiment helps to illuminate its likely scale.
Between 1983 and 2007, international phone traffic grew at a compounded annual growth rate (CAGR) of 15%, and traffic grew an even faster 21% CAGR between 1927 and 1983.
It's hard to believe then that the recent decline in traffic means that people have lost interest in communicating with friends and family abroad. Rather, it suggests that they are turning to other means of keeping in touch.
It's hard to believe then that the recent decline in traffic means that people have lost interest in communicating with friends and family abroad. Rather, it suggests that they are turning to other means of keeping in touch.
TeleGeography has fairly reliable estimates of Skype’s traffic through 2013, when the company carried 214 billion minutes of on-net (Skype-to-Skype) international traffic.
Telcos terminated 547 billion minutes of international traffic in 2013, and OTT plus carrier traffic totaled 761 billion minutes.
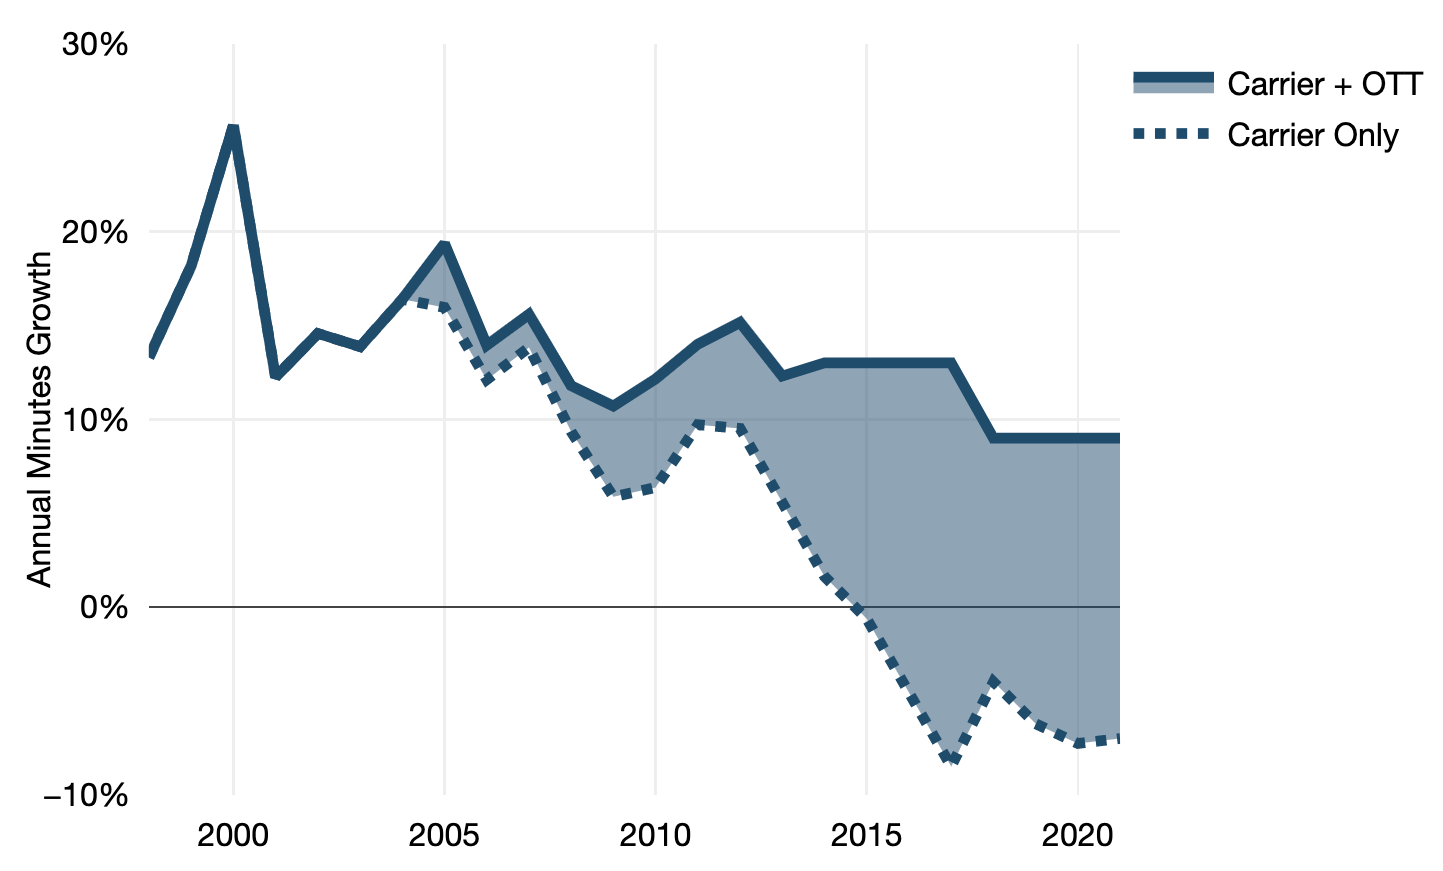
If we assume that total international (carrier plus OTT) traffic has continued to grow at a relatively modest 13% annually since 2013 (with a drop to 9% in 2018 due to texting, video, and email), the combined volume of carrier and OTT international traffic would have expanded to 1.6 trillion minutes in 2020, and to almost 1.8 trillion minutes in 2021 (see Figure: Where Did the Minutes Go?: The OTT Effect illustrates this nicely).
Traditional carrier traffic has slumped, but OTT traffic has risen to fill the void. This calculation suggests that cross-border OTT traffic overtook international carrier traffic in 2016, and would near 1.4 trillion minutes in 2021, dwarfing the 375 billion minutes of carrier traffic projected by TeleGeography.
Where Did the Minutes Go?: The OTT Effect
The TeleGeography Report and Database provides comprehensive voice traffic data and analysis. It features international voice traffic data for 61 countries and over 1,000 routes, with expert analysis on the impact of consumer VoIP (OTT) services, trends in retail and wholesale prices and revenues, as well as retail, wholesale, and interconnection rates.
You can download a full copy of this report’s executive summary over here.


Paul Brodsky
Paul Brodsky is a Senior Research Manager at TeleGeography. He is part of the network, internet, cloud, and voice research team. His regional expertise includes Europe, Africa, and the Middle East.