
The global outbreak of COVID-19—and its associated economic impact—has amplified the role played by the international telecommunications industry and the bandwidth market that underpins it. The global bandwidth market has always been marked by change and uncertainty, and the current crisis is just an extreme example of this.
Working and learning from home have dramatically altered traffic patterns, yet the internet has proven remarkably resilient in the face of these sudden changes. (More on that here.)
Many network operators are accelerating plans to add capacity to stay ahead of demand. Local ISPs are increasing caching capabilities to reduce reliance on international links. Content providers are reducing bit rates for streaming video applications in some regions to alleviate network congestion.
Meanwhile, life—and business—goes on.
On the commercial side, operators race to keep revenue margins ahead of eroding prices, while bandwidth demand and supply continue to grow across global routes.
Our Global Bandwidth Research Service assesses the state of the global telecom transport network industry, evaluates the factors that shape long-term demand growth and price erosion, and provides some preliminary thoughts on the impact of COVID-19 on the industry.
Today we're exploring demand trends and the role of content in the industry, using the latest data from our global bandwidth analysis.
Demand Trends
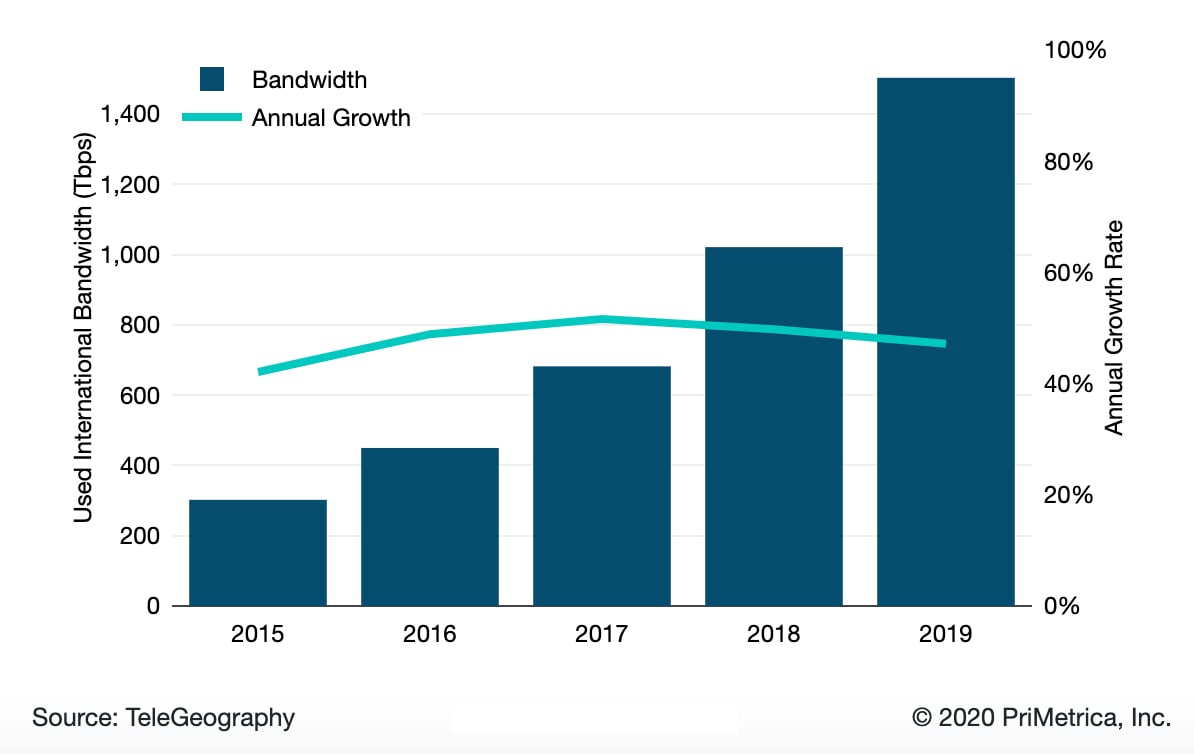
If demand is the key factor in assessing the health of the global bandwidth market, then the market is thriving. Between 2017 and 2019 alone, international bandwidth used by global networks more than doubled to reach 1,503 Tbps. (Note: the data examined is based on end of year 2019 data, and therefore does not reflect the impact of COVID-19.)
Worldwide International Bandwidth Growth
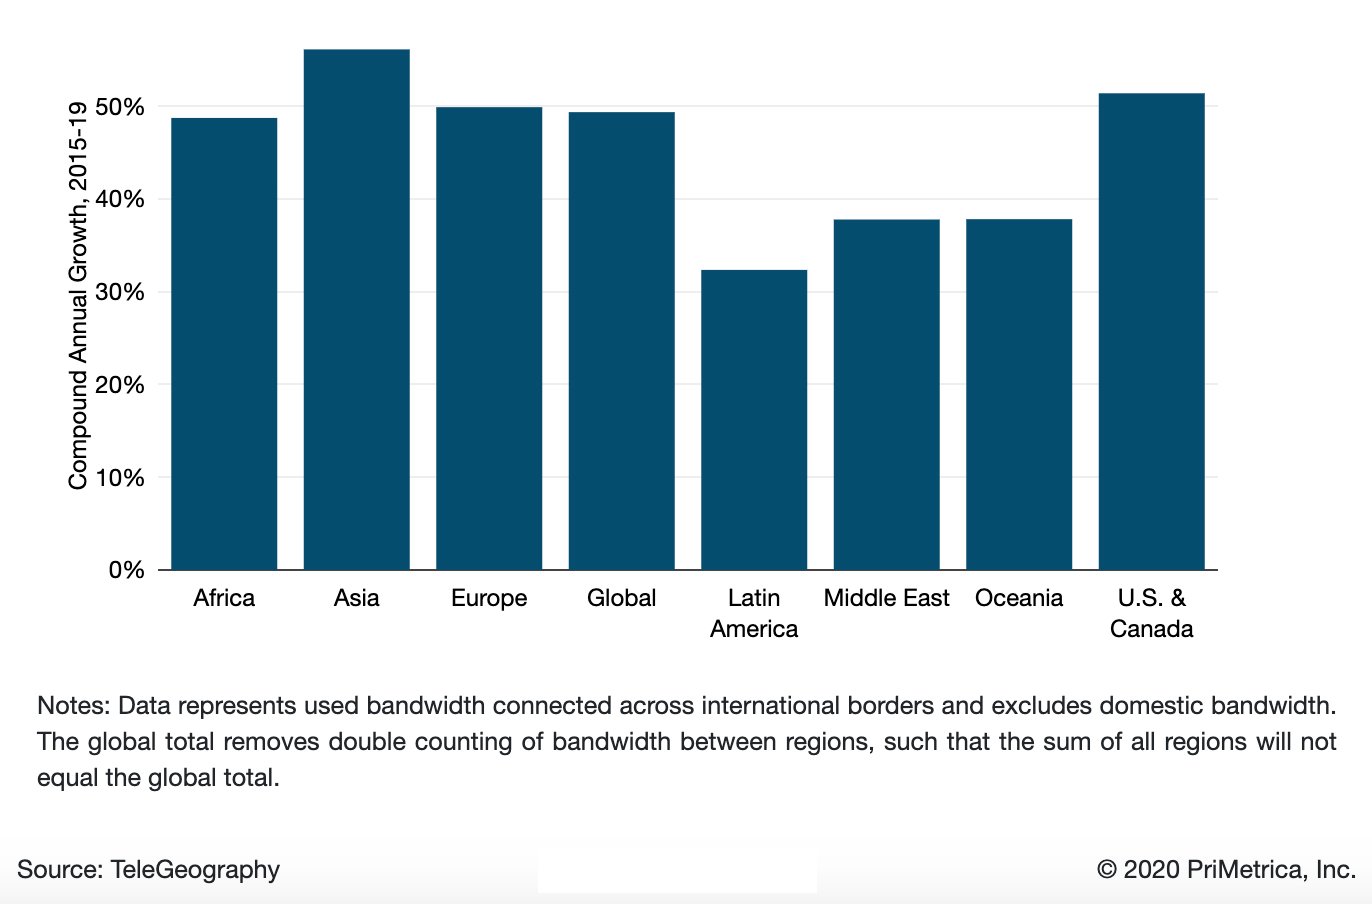
Let's break this demand growth down to a more granular level. If you look at the figure "Used International Bandwidth Growth by Region," two observations jump out.
While mature markets typically grow more slowly than developing markets, that's not the case when it comes to global bandwidth demand.
The first is that demand growth has been strongest on links connected to Asia, which experienced a compound annual growth rate of 56% between 2015 and 2019. The second is that growth in the most developed markets in the world—Europe and North America—wasn't far behind. While mature markets typically grow more slowly than developing markets, that's not the case when it comes to global bandwidth demand.
Used International Bandwidth Growth by Region
The Role of Content
Who's driving all this demand growth for international capacity?
Historically, it's been carrier networks, provisioning public internet services. More recently a handful of major content and cloud service providers—namely Google, Facebook, Amazon, and Microsoft—have become the primary sources of demand. As of 2019, these companies are now the dominant users of international bandwidth, accounting for 64% of all used international capacity.
More recently a handful of major content and cloud service providers—namely Google, Facebook, Amazon, and Microsoft—have become the primary sources of demand. As of 2019, these companies are now the dominant users of international bandwidth, accounting for 64% of all used international capacity.
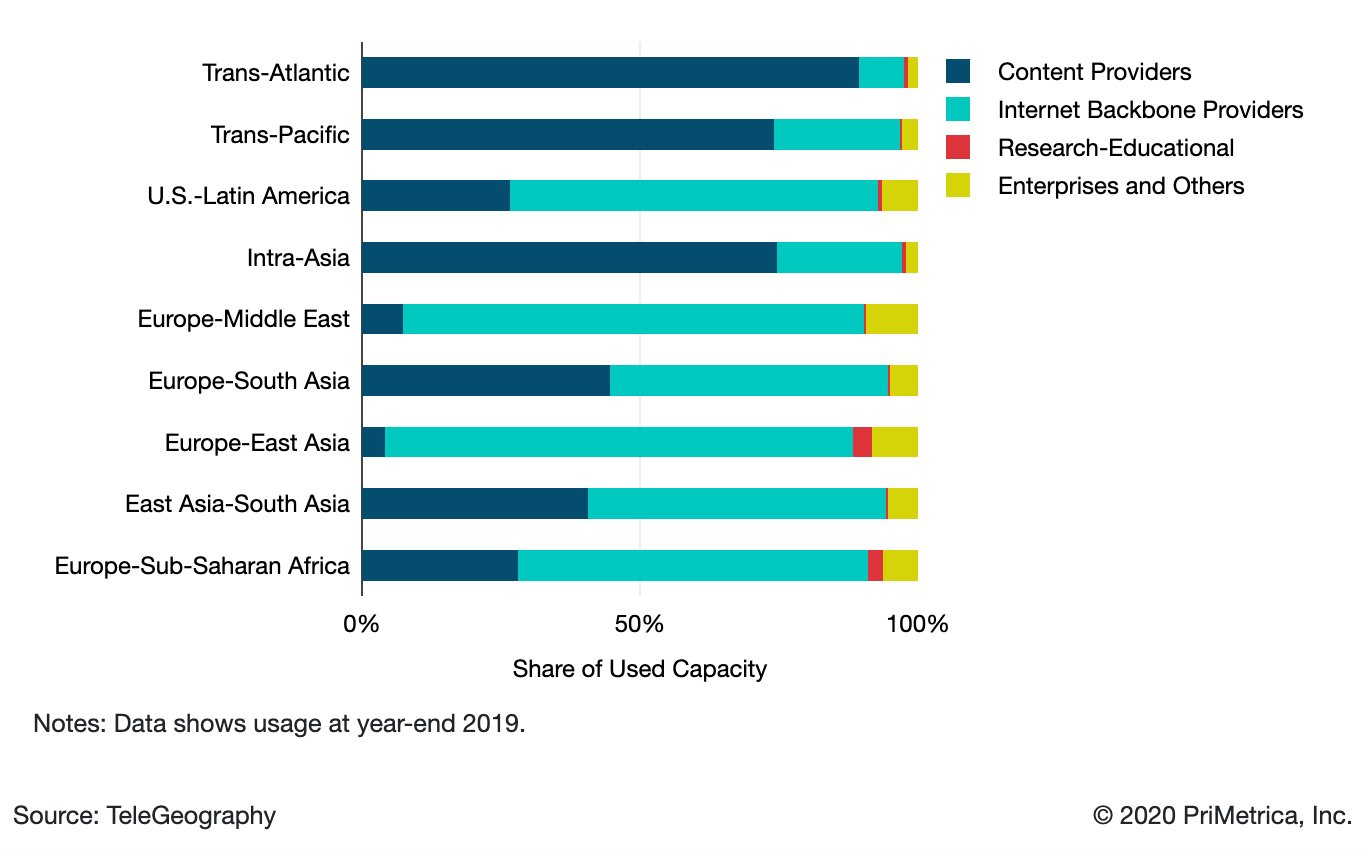
But their capacity requirements vary extensively by route. Content providers' top priority in their international network planning is to link their data centers and major interconnection points. As such, they often take tremendous capacity on core routes, while focusing much less than traditional carriers do on secondary long-haul routes.
To get a sense of this contrast, note that in 2019, content providers accounted for 89% of used capacity on the trans-Atlantic route but just 4% on the Europe-East Asia route.
Share of Used Bandwidth by Category for Major Routes
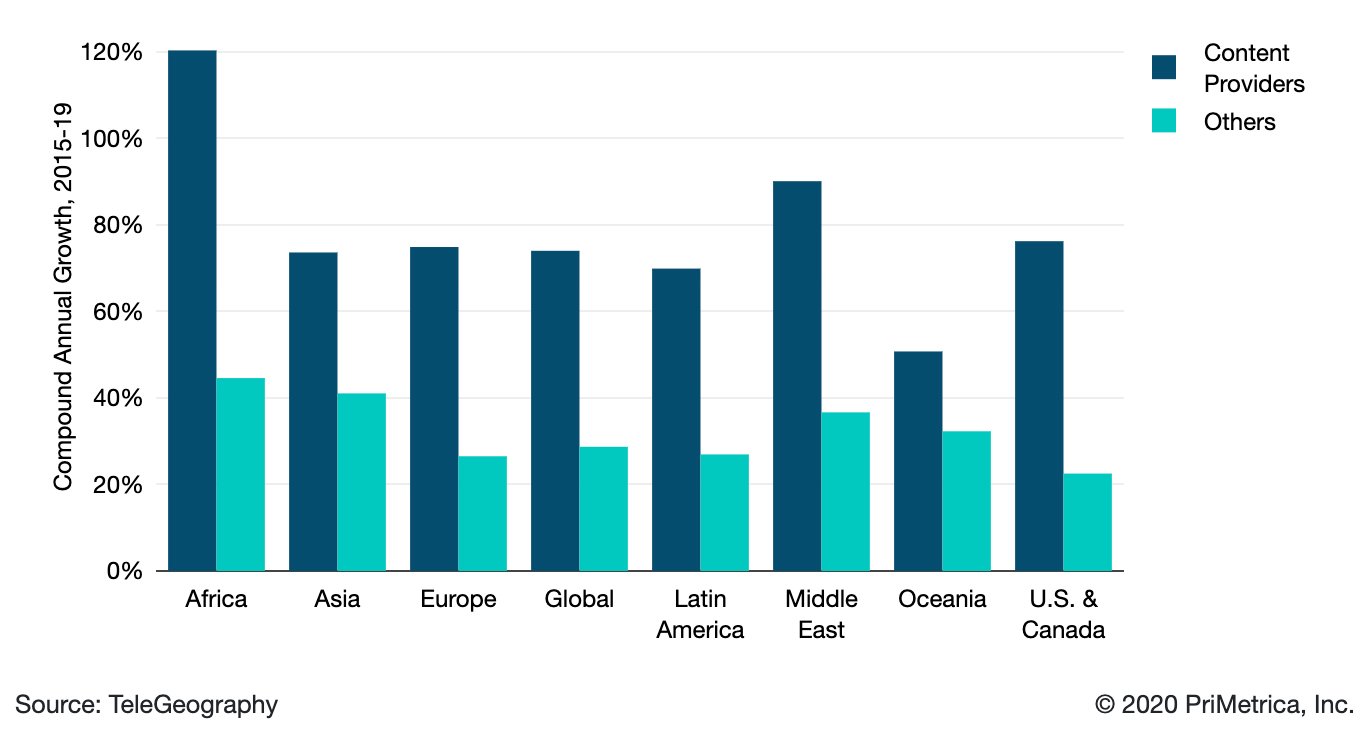
While the share of content provider capacity on some routes may be much lower than on others, the growth in their demand across all routes has been relentless. A comparison of content providers' international capacity demand growth compared to that of all other networks in the following figure reveals a stark contrast. Across six of the world's seven regions, content providers added capacity at a compound annual rate of at least 70% between 2015 and 2019, compared to a rate no higher than 45% for others.
Content Providers Versus Others Bandwidth Growth by Region


Paul Brodsky
Paul Brodsky is a Senior Research Manager at TeleGeography. He is part of the network, internet, cloud, and voice research team. His regional expertise includes Europe, Africa, and the Middle East.