
If you want a single, simple number to identify the best-connected provider in the world, you may come away disappointed.
There are several ways to measure connectivity, and each highlights different strengths and weaknesses of a provider’s presence.
One basic metric is to count the number of unique Autonomous Systems (AS) to which a backbone provider connects, while filtering out internal company connections.
Here’s what we found.
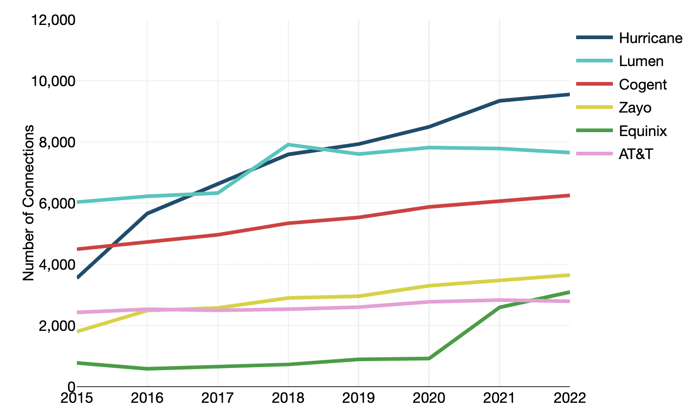
Hurricane Electric has experienced consistent gains, and now ranks as the clear number one in terms of connections. Cogent has also experienced steady growth.
Some members of the internet old guard, such as AT&T, have begun to slump in the rankings. Data center operator Equinix has now exceeded AT&T's number of observable AS connections, for the first time ever.
Number of Connections for Selected Providers
Our rankings of provider connectivity include analysis based on BGP routing tables, which govern how packets are delivered to their destinations across myriad networks as defined by autonomous system numbers (ASNs). Every network must rely on other networks to reach parts of the internet that it does not itself serve; there is no such thing as a ubiquitous internet backbone provider.
Every network must rely on other networks to reach parts of the internet that it does not itself serve; there is no such thing as a ubiquitous internet backbone provider.
In addition to examining overall number of connections, we also used our analysis of BGP routing tables to look at the “reach” (a measure of the number of IP addresses an upstream ASN has been given access to from downstream ASNs) and "share" (which compares an upstream provider’s reach to all other upstream providers of a downstream ASN.)
The results of this analysis paint a different picture.
In some cases, an ISP might end up high-ranked in terms of number of connections but low-ranked in terms of share or reach when the number of IP addresses passed from its customers is relatively small.
Finally, to focus on which backbone providers best serve the end-user ISP market and corporations, we compare upstream provider connections to downstream broadband ISPs, calculate the top providers to Fortune 500 companies, and examine connectivity to specific industry sectors such as hosting, medical, and finance.
In our Global Internet Geography Research Service, we analyze the meaning of our robust internet capacity and traffic data sets. We also discuss factors impacting IP transit pricing and the role individual backbone operators play.
Download the 2022 Executive Summary to keep reading our latest analysis.

Paul Brodsky
Paul Brodsky is a Senior Research Manager at TeleGeography. He is part of the network, internet, cloud, and voice research team. His regional expertise includes Europe, Africa, and the Middle East.