


We have a years-long tradition of Mythbusting here at TeleGeography. But it occurred to me that we’ve never tackled any of the WAN pricing myths floating around out there. That’s why I decided to do a series addressing some of the things I hear from WAN-sourcing and WAN-selling professionals.
Let’s see if these WAN pricing myths stack up against the data.
First up: is it true that, particularly for traditional MPLS networks, local access can account for upwards of 50% of the total cost of ownership (TCO) of WAN components?
This is familiar to anyone purchasing WANs in the past several years. In fact, going back to the very first WAN Summit in 2013, I did a presentation on the difficulty and expense of acquiring access for your MPLS network.
Let’s break it down.
End-to-End Prices Vary by Geographic Location
I started out by looking at how MPLS and access prices for the same bandwidths stack up in markets across the globe. As I usually do for MPLS pricing analysis, I’ve used a CoS mix of 10% voice/video, 30% real time data, and 60% best efforts and matched MPLS port and access bandwidths exactly.
I’ve reviewed this for a variety of capacities; the trends aren’t radically different across port/circuit sizes, except perhaps at the very high end like >GigE where there are relatively few MPLS and access data points.
To keep this simple, I’ll show 20 Mbps, which is still the most typical MPLS port size out there. These prices are for the 0-5 km access distance band representing offices in central business districts.
How Much Do Access and Port Contribute to Site Cost in Key Global Cities?
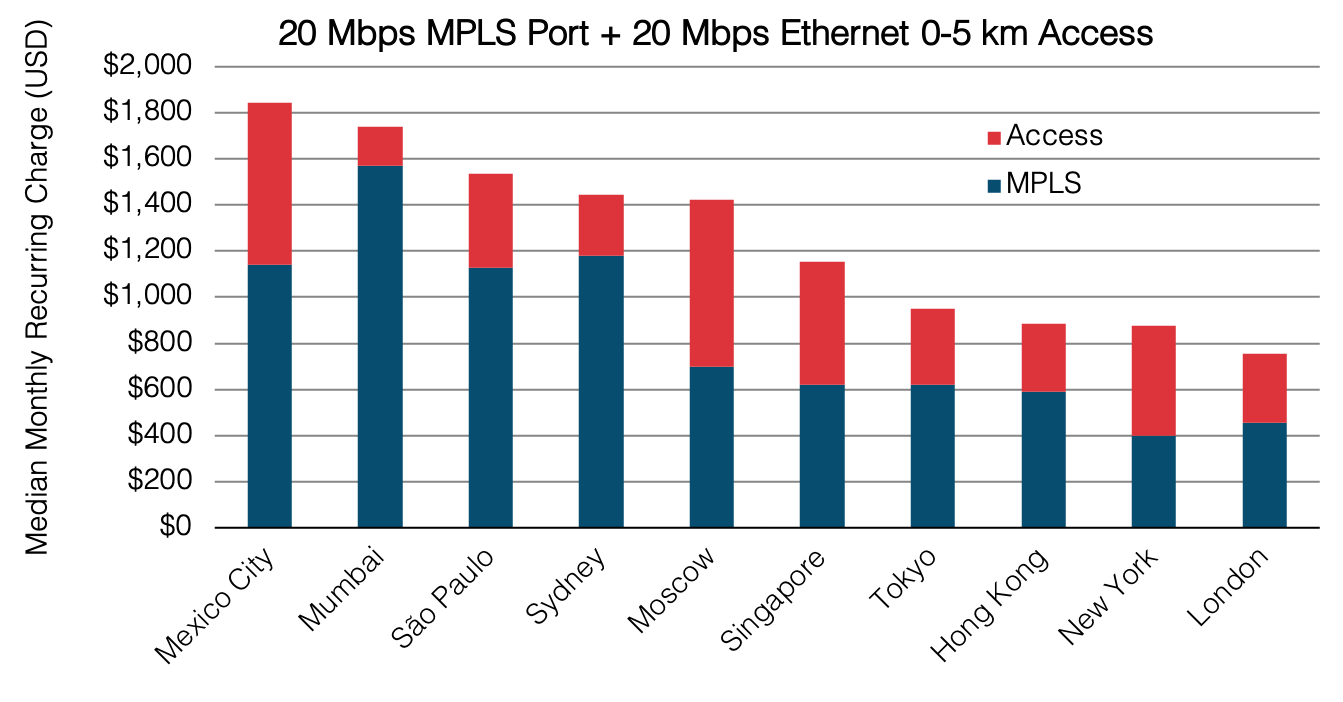
The upshot is that the balance between MPLS port cost (at CoS 10/30/60) and 20 Mbps Ethernet access cost is all over the place across key business centers.
- India is a market where network is very expensive and access is very cheap with a split of 90% port and 10% access.
- NYC is on the other end. Network is fairly cheap but Ethernet access prices are high for a developed, competitive market—46% port, 54% access.
- Other than NYC, only Moscow has more cost going to access, and only 51%, at that.
- In most cities, the MPLS port is >50%, so it’s looking kind of bad for this myth so far.
Application to a Full WAN Helps With the Big Picture
Looking at the balance in individual cities doesn’t give us the whole picture.
But fear not. Last year I created a hypothetical network designed to test all kinds of WAN myths (or scenarios) and I’ve loaded in our latest data. You can read about that hypothetical network over here if you want to get the full parameters. In a nutshell, it’s a 150-site network scattered across the globe with most sites in the 11-50 Mbps bandwidth range.
The first network we start with in all our scenarios—the control network, so to speak—is where you or your enterprise customers might well have been a few years ago, and many still are. It’s a mostly-MPLS IP VPN network with redundant access lines going to passive MPLS backup ports.
Split Between Port and Access for a Mostly-MPLS WAN
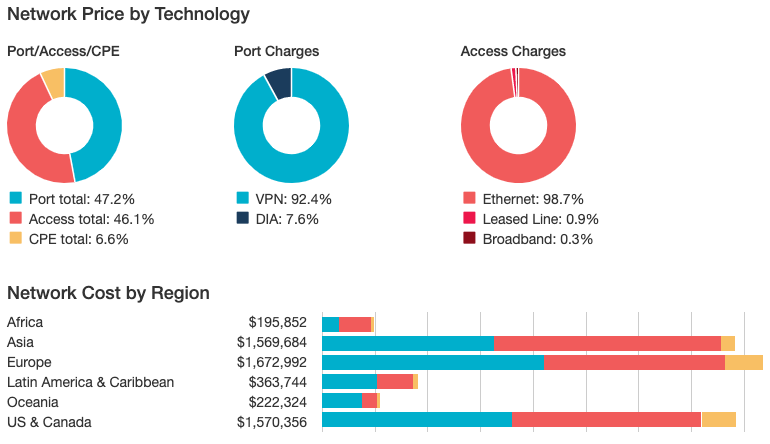
^This screenshot from the WAN Cost Benchmark tool where I built this model shows the split between port, access, and CPE. It’s all in the top left donut, but I left in the rest of the dashboard for context.
So far, it looks like this myth is kind of busted, but just barely. Here, access is 46% and port is 47%. The rest is CPE, which is a small part of the TCO, but worth remembering.
But, recall, this is with fully redundant access lines since we have a traditional mostly-MPLS network. Most sites have only an MPLS connection and its backup. In our standard benchmarks and in my hypothetical we assume that a backup access line is charged at full cost—as the carrier has to source it whether or not it is used—and the passive port is charged as a discount. (We use 50% unless our customer has a different arrangement).
What happens when we move to an SD-WAN-enabled hybrid and ditch the backups?
Getting Rid of Backups
How Are Port and Access Costs Split in a Hybrid MPLS-DIA Network With No Backups?
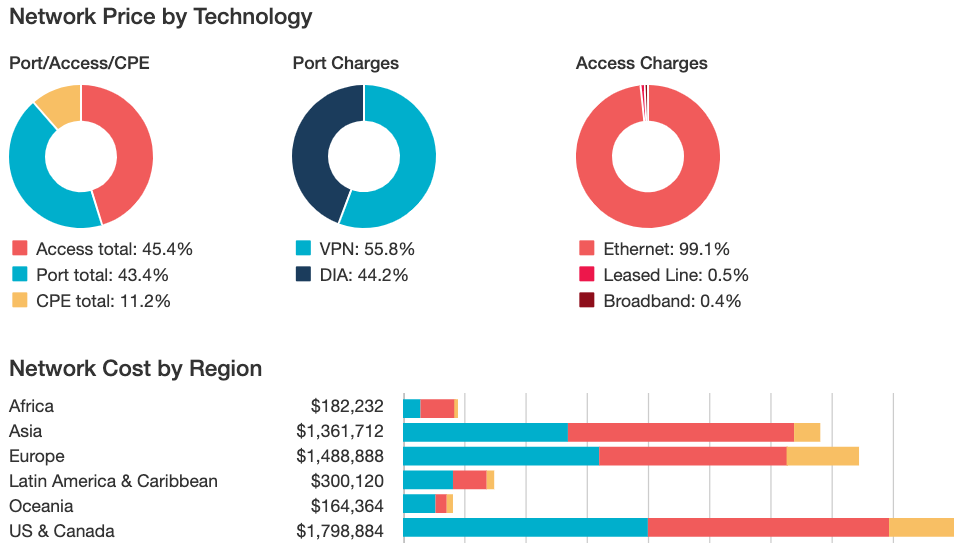
Enterprises that adopt SD-WAN can use its active-active failover capability to shift traffic on a failed MPLS circuit to some other service like DIA. This might be preferable to having an additional access line and active or passive MPLS port.
Note that I’ve left out SD-WAN costs, as 1) they’re pretty small compared to MPLS and access network costs, and 2) they aren’t really network charges per se, which is what this myth is based on.
Turns out that the split went a little more in the access direction (45%) compared to port (43%). I have to admit I found this result surprising, seeing as we’re giving up on those backup MPLS lines (true that we also lose MPLS backup ports, but we only charge those at 50% full MRC).
However, a couple of things happened: 1) we reduced MPLS port sizes and the DIA we added is cheaper than MPLS IP VPN, and 2) the DIA and MPLS get their own separate access loops. Otherwise SD-WAN can’t operate as a backup replacement—so we still have double access loops at each site.
Looking good for the myth again? Sure, access is only 45% here due to higher CPE costs from having two different port services, but it’s still more than port charges.
As I have addressed in past posts, it’s often the case that enterprises can get on-net DIA without additional access costs. When we run that network, we see a pretty dramatic reduction in the share of the TCO going to access.
How Are Port and Access Costs Split in an MPLS-on-Net DIA WAN With No Backups?
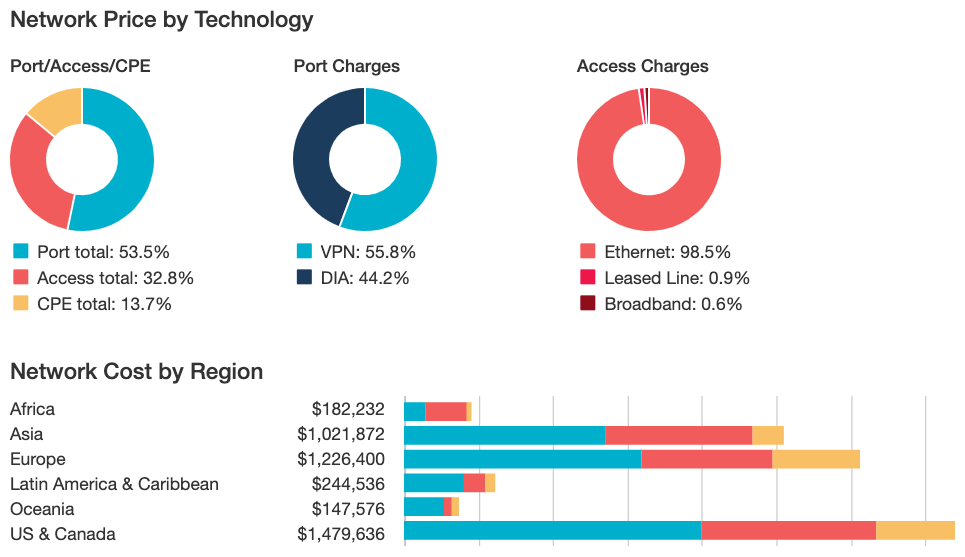
Now we see more of what I would have expected with the port services taking over the clear majority of the TCO (54%).
Myth back to busted, then?
Office Location Matters
All of this analysis was based on our hypothetical network, which is mostly located in the central business districts of urban markets around the world.
This probably works for a hypothetical enterprise like Acme, Blarney & Chad, LLP—a law or accounting firm. I’m envisioning someplace with a downtown office where workers buzz in and out, carrying cups of coffee and doing the whole watercooler gossip routine.
But what if we’re looking at Acme Widget Inc, which has several factories outside the city or in secondary or tertiary markets?
To test this, I created a WAN based on the original mostly-MPLS network, but with more remote sites. This includes connecting satellite cities to a distant carrier PoP.
Local Access Line Distribution in Our Hypothetical WANs
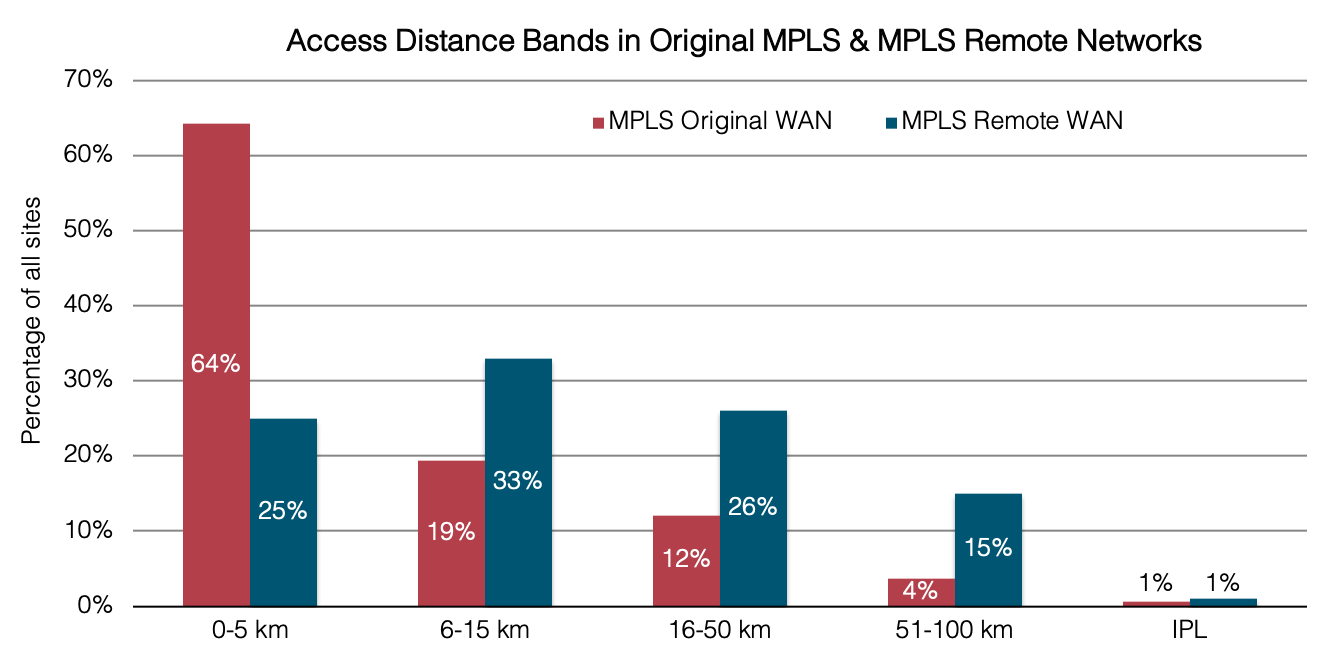
As you can see, the central business district sites in the 0-5 km distance band went from being about two-thirds of the network to being a quarter.
Suburban sites bumped up from a fifth to a third and a quarter of sites are now in the exurbs or outer rings of metro areas. I also shifted to about 15% being well outside the PoP metro in another city or town.
How Much Does a More Remote Network Shift the Balance Between Port and Access Costs?
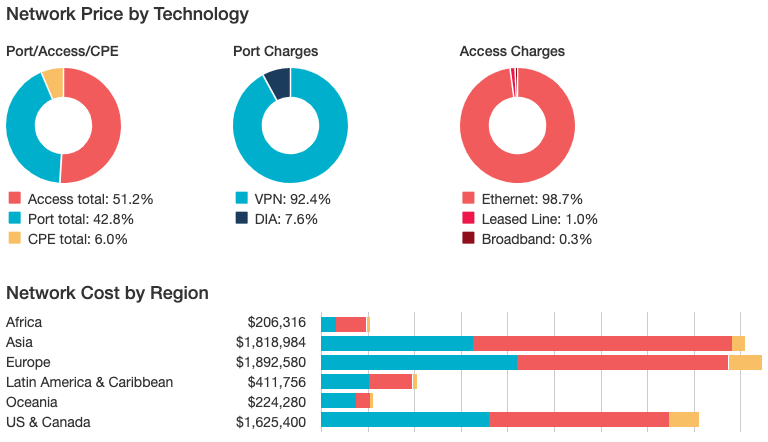
There we go!
We finally have a network with more than 50% of the port, access, and CPE costs going to access (51%).
Is This Myth Busted?
I’m going with a solid “plausible” on this one.
That is a less annoying way of saying the analyst’s favorite phrase: “it depends.”
This myth could be confirmed in some cases, but it requires a few caveats:
- It’s more likely to be true of mostly-MPLS networks. Hybrids with many sites using on-net DIA or broadband have lower access costs.
- It’s more likely to be true if the mostly-MPLS network has passive, discounted MPLS backups with fully redundant, full price access lines.
- It’s more likely to be true of MPLS-DIA hybrid WANs if much of the DIA is mostly off-net.
- It’s most likely to be true when the network includes a greater number of remote sites (and presumably greenfield or uncompetitive sites as well).
Catch up on more WAN Mythbusting:
- Is MPLS Priced Like DIA?
- Can SD-WAN Cut Your Network Spend in Half?
- Do Tier 1 Carriers Charge More for DIA?


Greg Bryan
Greg is Senior Manager, Enterprise Research at TeleGeography. He's spent the last decade and a half at TeleGeography developing many of our pricing products and reports about enterprise networks. He is a frequent speaker at conferences about corporate wide area networks and enterprise telecom services. He also hosts our podcast, TeleGeography Explains the Internet.