


My wife has a brutal Northern Virginia commute; she drives about 80 miles a day. Recently, we decided it was time for a new car for her.
Now, normally we lean toward the lightly used car, as a new car can depreciate as much as 10% the minute you drive it off the lot. But with the kind of mileage she does, we had to do more thinking about the real total cost of ownership beyond simple sticker prices. (Full confession, I built several models based on various used and new cars with mileage estimates, gas prices, and maintenance costs—yes, I am an analyst).
In the past couple of years, hybrid electric technology has changed rapidly and few, if any, used cars have the efficiency of many 2019 models. We settled on a plug-in hybrid that has been averaging around 350 mpg! Sure, we lost some on driving the new car off the lot, but going from getting 25 mpg to 350 mpg has proven to be very cost effective when driving something like 500 miles a week.
This got me thinking, naturally, about benchmarking.
WAN technology, like hybrids, has changed rapidly in the past couple of years, and many enterprises are going through the “rip and replace” calculation to evaluate if it’s worth it to adopt SD-WAN and rethink their underlay strategy.
WAN technology, like hybrids, has changed rapidly in the past couple of years, and many enterprises are going through the “rip and replace” calculation to evaluate if it’s worth it to adopt SD-WAN and rethink their underlay strategy. Just as your weekly miles driven might affect your auto TCO, your site bandwidth demands might well have a big influence on whether you go for SD-WAN instead of just sticking with MPLS.
The rest of this blog series is going to be dedicated to various SD-WAN-enabled network options and how they might affect both your total site bandwidth and the bottom line.
The Transition to the SD-WAN-Enabled Network
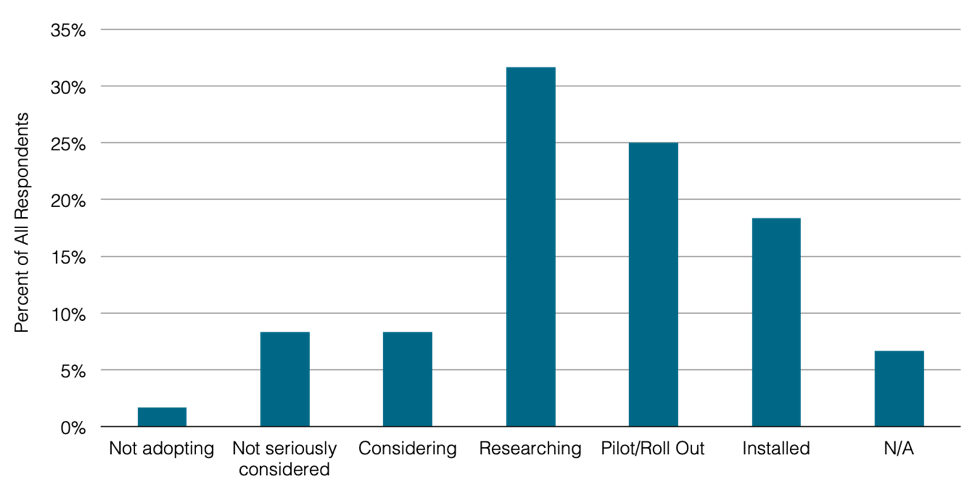
While SD-WAN has been a hot topic for the last few years, adoption has been slow to materialize. But this could be the year when the ball really gets rolling. Among our 2018 WAN Manager Survey respondents, 83% said they were at least considering SD-WAN, or were further along in adoption.
Although only 18% of respondents already had SD-WAN installed on all or much of their network, 25% were in the pilot or roll out stage. Another 32% were researching providers or service options.
How Prominent is SD-WAN in the Market?
2018 WAN Manager Survey Stage of Adoption of SD-WAN
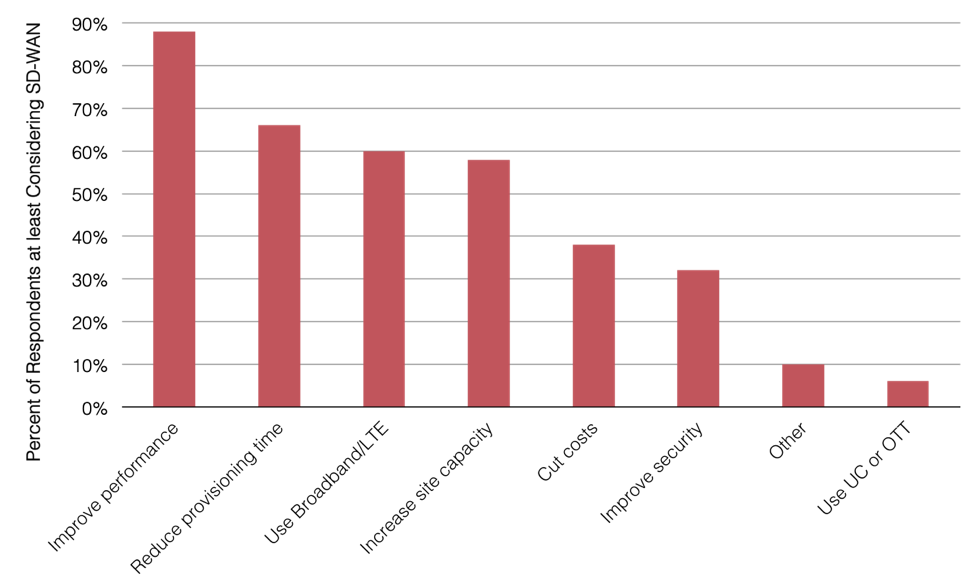
When SD-WAN was first commercially available, much of the marketing and discussion was around saving considerable spend on the WAN. Over time, we’ve seen that discussion move more toward performance, and our 2018 WAN Manager Survey results supported this shift. Among those at least considering SD-WAN adoption, only 38% indicated they were interested in cutting network costs, while most cited improving performance and reducing provisioning time as key factors.
As we’re going to see, however, it’s still very much possible to cut network costs while increasing capacity, even after accounting for additional SD-WAN costs.
Why Do Enterprises Adopt SD-WAN?
2018 WAN Manager Survey Reasons for Adopting SD-WAN
Keeping MPLS After SD-WAN Adoption
While a strong majority of the WAN managers we surveyed are planning to adopt SD-WAN, 64% are also planning to keep MPLS in the near future. Many enterprises are wary of giving up on MPLS altogether and trusting all of their traffic to SD-WAN and the internet.
With that in mind, we’re going to review several hybrid scenarios that keep MPLS at most or some sites.
MPLS-DIA & SD-WAN Hybrids
One of the defining features of any SD-WAN service is that it allows for active-active line testing and traffic load balancing. So if a line goes down or is experiencing issues, traffic can be redirected to another line automatically based on policy rather than waiting for engineers to react. This capability means that backing up an MPLS connection becomes less crucial and maybe even unnecessary.
In this DIA hybrid scenario, if an MPLS line goes down, the active DIA connection is available to pick up the slack. And even though there is no CoS, there are features in basically all SD-WAN services—such as forward error correction—to mimic at least some, if not all, MPLS QoS benefits.
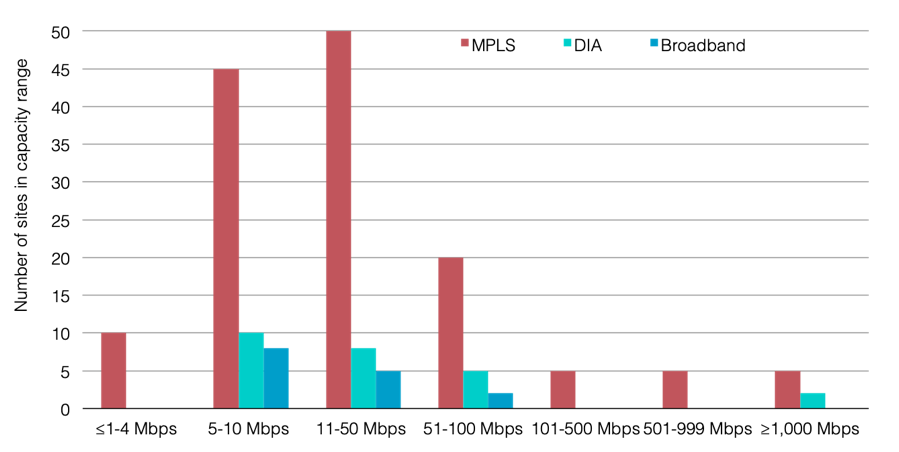
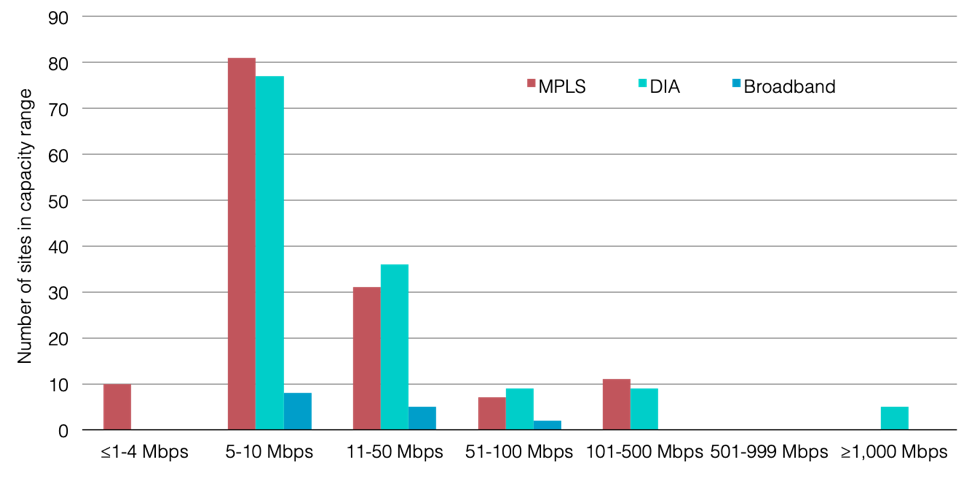
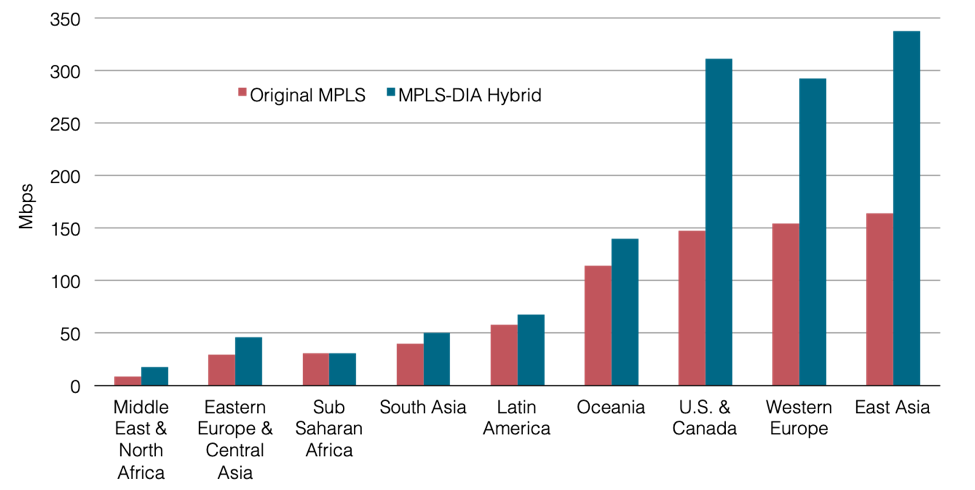
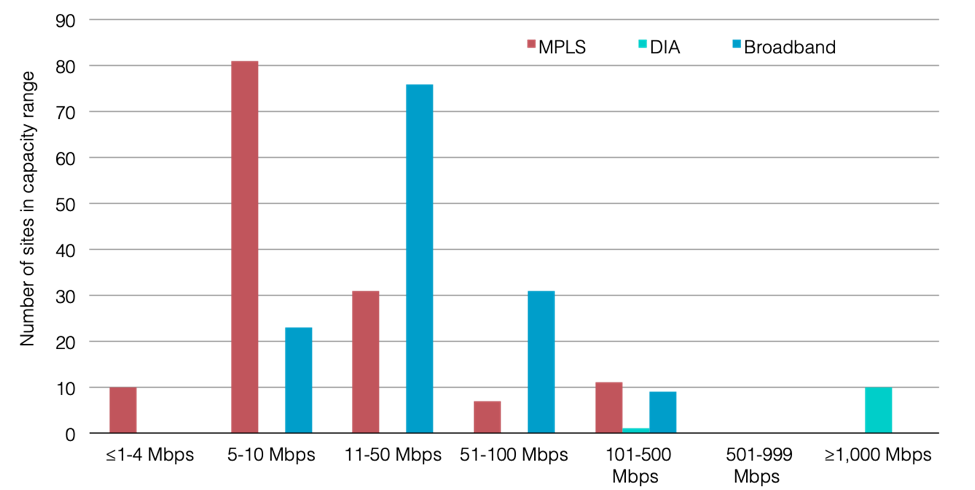
This being the case, the first SD-WAN-enabled scenario we tested was the same MPLS-DIA hybrids as in this previous DIA post, except that we removed all the backup access lines and MPLS ports. As a reminder, we lowered many MPLS ports where we could—sometimes as much as 50%—and added DIA of around the original MPLS port size at all 140 sites that had been connected only by MPLS. The average total available capacity per site ended up almost doubling from 125 Mbps in the original MPLS network to 241 Mbps in the DIA hypotheticals.
How Did We Change Capacity Ranges from the Original MPLS WAN?
Original MPLS WAN Site Capacity Range
MPLS DIA Hybrid WAN Site Capacity Range
Much of the capacity increase was in the U.S. & Canada, Western Europe, and East Asia, where the headquarters and data center sites are located.
Only sub-Saharan Africa had the same average site capacity.
How Does Average Site Capacity Change by Subregion?
MPLS-DIA Hybrid WAN Average Total Site Capacity by Subregion
In this round, we also added in SD-WAN costs. SD-WAN providers (both vendors and managed services providers/carriers) may charge for SD-WAN based on:
- The NRC for any install and equipment fees
- The number of controllers needed for the network
- Software license fees
- MRC for the total amount of encrypted throughput needed at each site
The encrypted throughput for any site is the total active capacity, and in this case, the total combined MPLS and DIA port sizes.
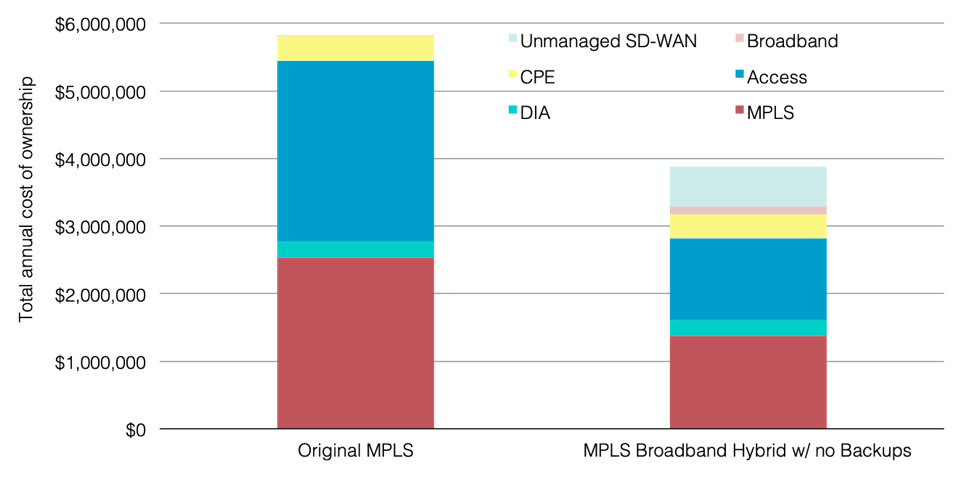
How Did Dropping MPLS Backups and Adding SD-WAN Change the TCO?Original MPLS, MPLS-DIA No Backups, & On-net DIA No Backups with Unmanaged SD-WAN Annual TCOs
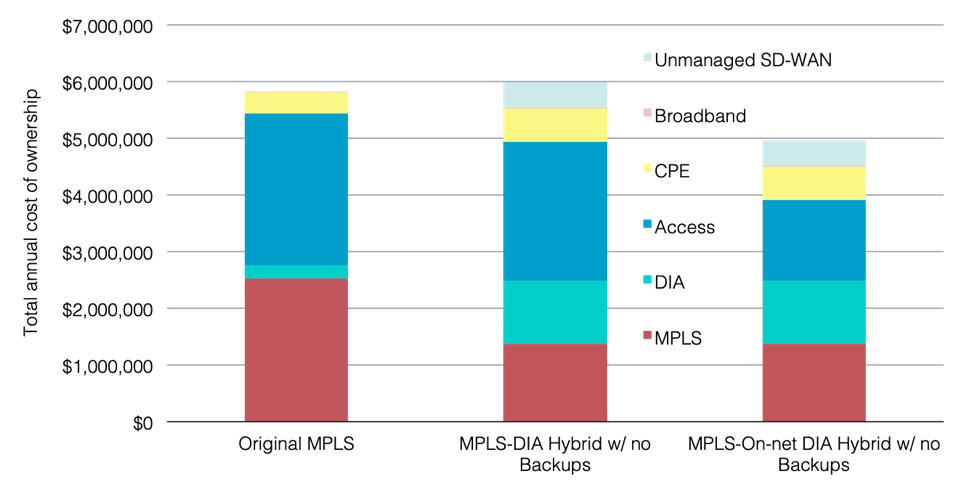
Removing the backups cuts the MPLS costs as well as access, since we can get rid of the passive but full charge access lines. Once we add an unmanaged SD-WAN overlay on top of the network underlay, the TCO comes out to 3% more than our original MPLS network. But recall, this is while nearly doubling the average available site capacity from 125 Mbps to 241 Mbps. This would certainly describe those who might wish to improve performance even if it doesn’t reduce costs.
However, if we also assume that the network is mostly in locations where on-net DIA is available and bring in our on-net DIA scenario with no MPLS backups, the savings are much more significant at 15% below the original MPLS network, even with the additional costs for SD-WAN.
MPLS-Broadband & SD-WAN Hybrids
The previous post in this series looked at adding broadband for local internet breakouts instead of DIA; we can do the same analysis here. While the ins and outs of using broadband instead of DIA are outlined in that post, suffice it to say that broadband may be less reliable and in some cases harder to source, but the savings are such that one can “throw bandwidth at the problem.”
How Did We Change MPLS-Broadband WAN Capacity Ranges from the Original MPLS WAN?
Original MPLS WAN Site Capacity Range
MPLS-Broadband Hybrid WAN Site Capacity Range
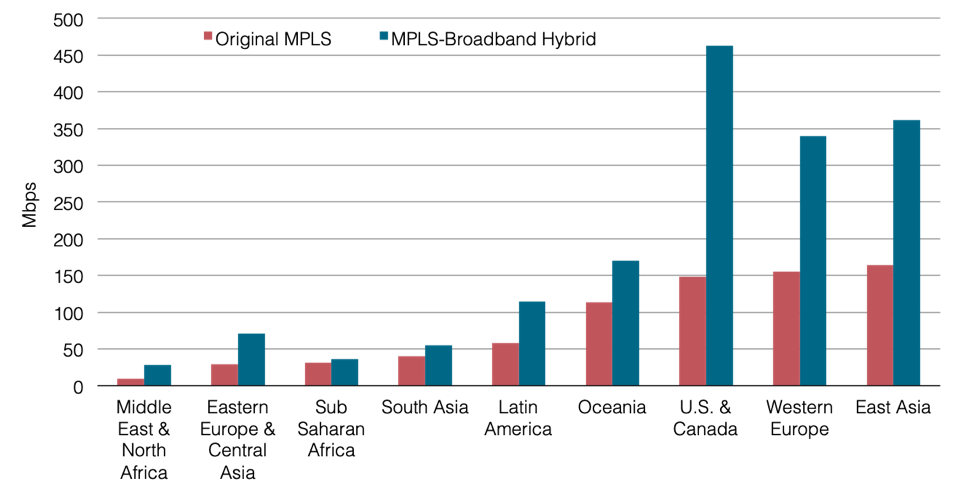
The details of this network scenario haven’t changed from the MPLS-broadband hybrid in the previous post, but again, we dropped MPLS port sizes in the same places and amounts as the DIA scenario and added even larger broadband circuits where we could. This resulted in a 2.5 times increase in average available site capacity over the original MPLS network for a global average of 311 Mbps per site.
How Does Average Site Capacity Change by Subregion?
MPLS-Broadband Hybrid WANs Average Total Site Capacity by Subregion
One important caveat to this network is that since SD-WAN costs are based on the total encrypted throughput at the site, larger total capacity sites (MPLS + broadband) will mean higher SD-WAN costs. However, even after adding in about $590,000 of unmanaged SD-WAN, the savings has increased considerably by dropping the backup access lines and passive MPLS VPN ports an adding cheap bandwidth through broadband. This hypothetical is a 33% decrease in price for a 150% increase in capacity!
How Does Dropping MPLS Backups with Broadband and SD-WAN Affect the TCO?
Original MPLS & MPLS-Broadband Hybrid no Backups WANs with Unmanaged SD-WAN Annual TCOs
Just like going for the modern plug-in hybrid if you have a lot of miles to drive, kicking in for the additional SD-WAN costs and adding capacity with DIA and broadband can be advantageous if you need more bandwidth at your sites. As we’ve seen with both DIA and broadband, freeing your network from MPLS backups can lead to savings while boosting capacity.
Next time we are going to check out a scenario that we’ve heard about from some of our survey interviewees in which they keep MPLS at a few key sites after adopting SD-WAN in a scenario we call the “MPLS-core.”
Next up:

Greg Bryan
Greg is Senior Manager, Enterprise Research at TeleGeography. He's spent the last decade and a half at TeleGeography developing many of our pricing products and reports about enterprise networks. He is a frequent speaker at conferences about corporate wide area networks and enterprise telecom services. He also hosts our podcast, TeleGeography Explains the Internet.